Figure 1.
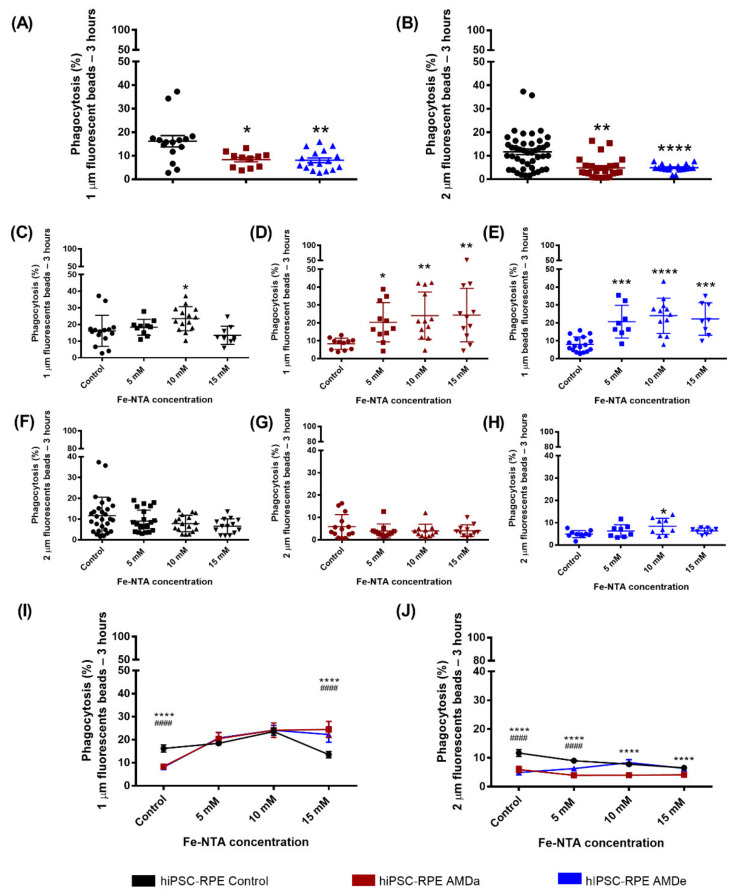
Non-specific phagocytosis function of hiPSC RPE Control and AMDa/e cell lines in both basal and oxidative stress conditions. Non-specific phagocytosis quantification in hiPSC-RPE Control (N = 6, n = 3), AMDa (N = 6, n = 3) and AMDe (N = 3, n = 3) cells in basal condition (A,B) and 24 h oxidative stress condition induced by different Fe-NTA concentrations (C–J). For I and J, comparison between hiPSC Control and AMDa (*) or AMDe (#). Statistical analysis: Kruskal–Wallis. * p < 0.05 ** p < 0.01 *** p < 0.001 ****, #### p < 0.0001.

