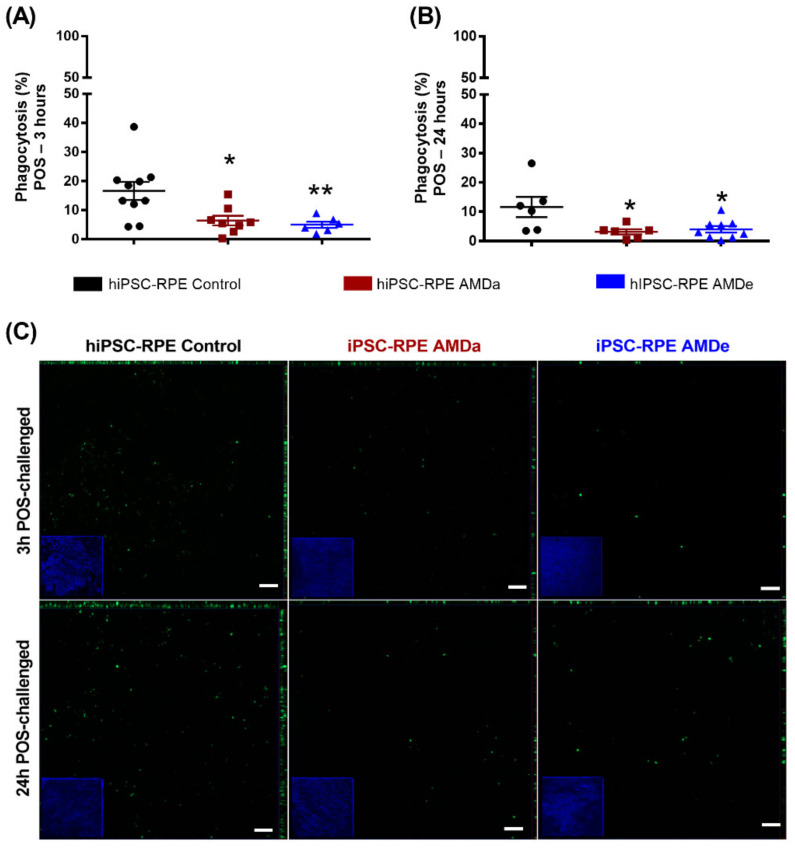
Figure 2.
Specific phagocytosis function of hiPSC RPE Control and AMDa/e cell lines in basal condition. Quantification of 3 h POS exposure (A) and 24 h POS exposure (B) in hiPSC RPE Control (N = 5, n = 2), AMDa (N = 6, n = 2) and AMDe (N = 3, n = 2) cells in basal condition. Representative immunofluorescence of 3 and 24 h POS exposure in hiPSC-RPE Control and AMDa/e cells (C). Micrographs on the borders are related to an orthogonal view of hiPSC-RPE cells (N = 2), AMDa (N = 3) and AMDe (N = 3) Scale: 50 µm. Statistical analysis: Kruskal–Wallis. * p < 0.05 ** p < 0.01.

