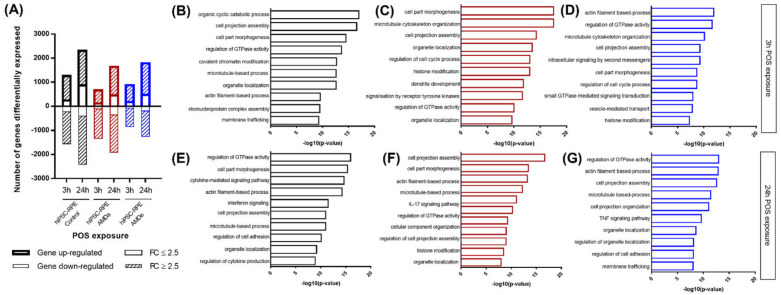
Figure 4.
RNA seq analysis of both hiPSC RPE Control and AMD cells after 3 h and 24 h POS exposure. Number of differentially expressed genes in hiPSC-RPE Control (N = 6) AMDa (N = 6) and AMDe cells (N = 3) in basal condition, and after 3 h and 24 h POS exposure (A). The Gene Ontology (GO) analyses of highly or lowly (2.5 ≥ FC ≥ 2.5) expressed in hiPSC-RPE Control (B,E) AMDa (C,F) and AMDe cells (D,G) after 3 h (B,C,D) and 24 h (E,F,G) POS exposure.

