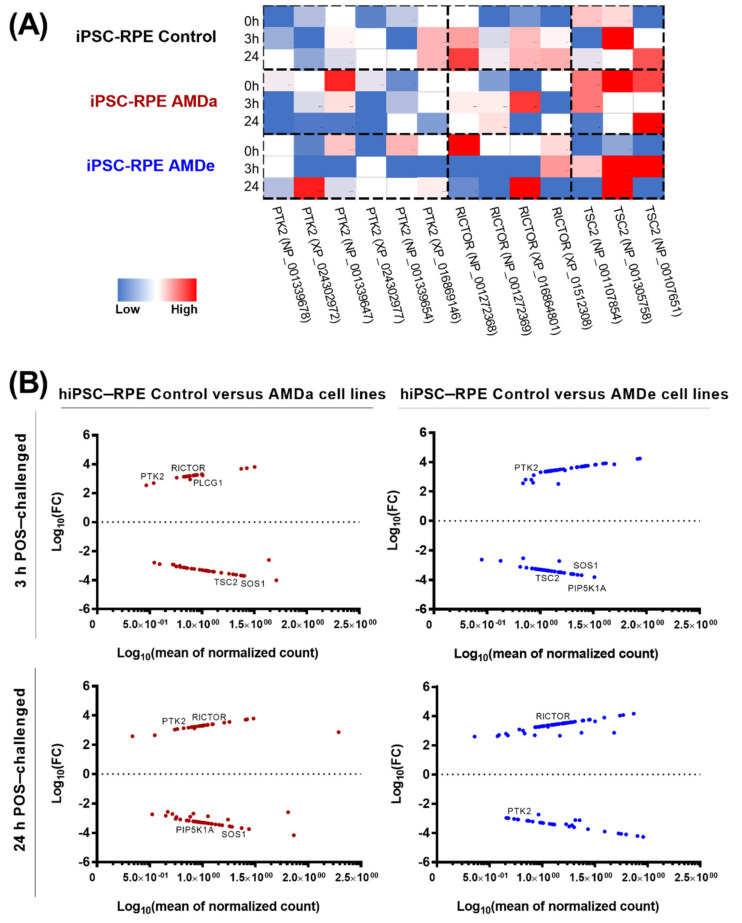
Figure 5.
Analysis of specific mTOR/PI3K-AKT/MEK-ERK pathway with RNA-seq. Heat map of 3 enriched genes (PTK2, TSC2, RICTOR) involved in GTPase regulation pathway in hiPSC-RPE Control, AMDa and AMDe cells in basal condition and after 3 and 24 h POS exposure (A). Volcano plot of differentially expressed genes between hiPSC-RPE Control and AMDa cells and between hiPSC-RPE Control and AMDe cells after 3 and 24 h POS exposure (B). hiPSC-RPE Control cells N = 6, hiPSC-RPE AMDa cells N = 6, hiPSC-RPE AMDe N = 3.

