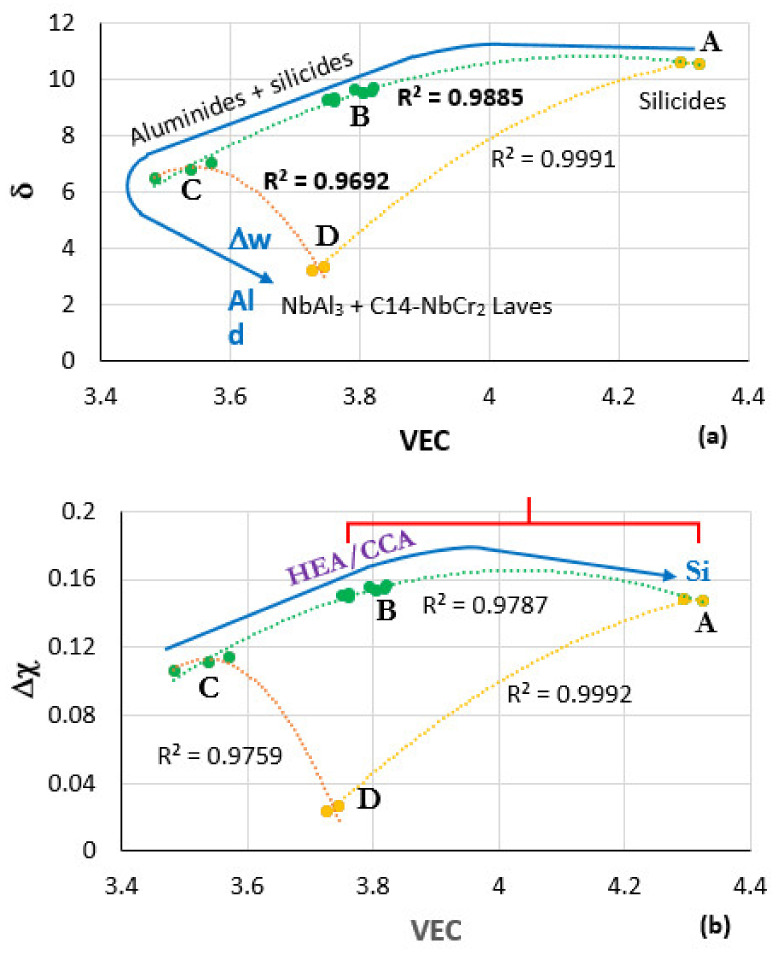
Figure 8.
Maps of the parameters δ, Δχ, and VEC with data for the alloys OHC5 [39], MG5, MG6, MG7 [11,22], Zone A of MG7 [11] and OHC3 [10]. In the maps, A corresponds to OHC5, B to MG5, MG6, MG7, C to Zone A of MG7, and D to OHC3. The microstructures in different areas of the maps and the “direction” of increase in Al concentration, mass change per unit area (Δw) and oxide scale thickness (d) are shown in (a). The area where alloys could be considered as HEA or CCA and the direction of increase of Si concentration in the map are shown in (b). The area where the oxidation rate constants of the BC alloys are in the range of NiAl and Ni-Cr-Al alloys at 1200 °C is shown with the red bracket in (b).

