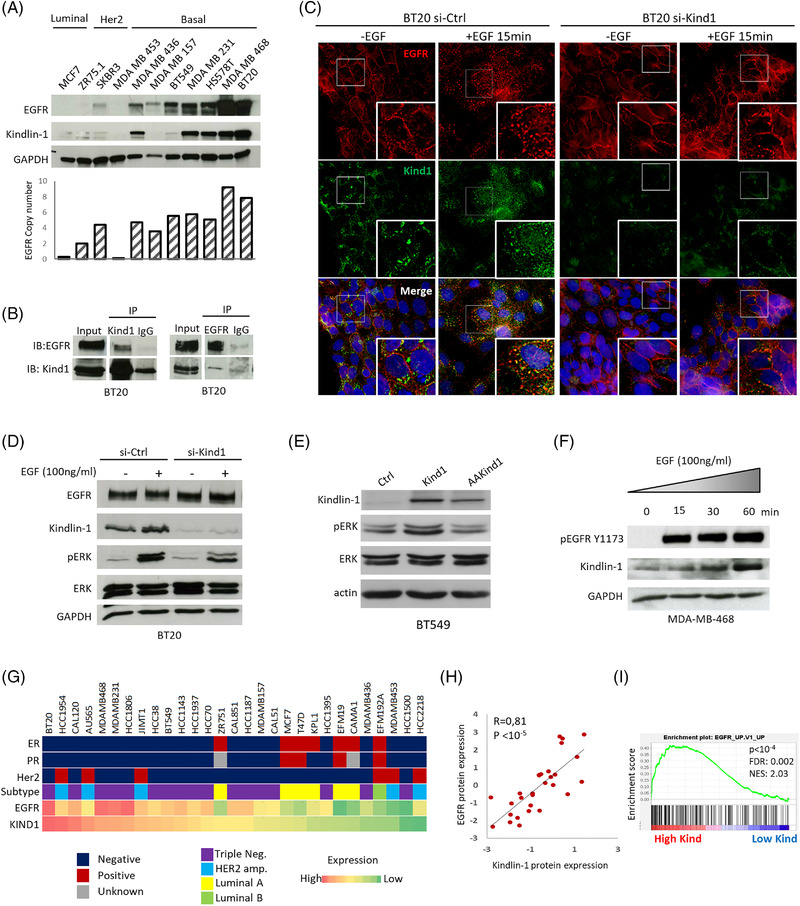
FIGURE 1.

Kindlin‐1 interacts and colocalises with epidermal growth factor receptor (EGFR), promoting the EGFR pathway in breast cancer cells. (A) Western blots of Kindlin‐1 and EGFR in different breast cancer cell lines representing the different subtypes (Luminal, Her2 and Basal) of breast tumours. The EGFR copy number is shown for each cell line. (B) BT20 cells were immunoprecipitated with either normal rabbit IgG, as a negative control (IP: IgG), anti‐Kindlin‐1 (IP: Kind1) or anti‐EGFR (IP: EGFR) antibodies. Immunoprecipitates were examined by immunoblotting with anti‐EGFR and anti‐Kindlin‐1 antibodies. (C) BT20 cells were transfected with control siRNA (si‐Ctrl) or Kindlin‐1 siRNA (si‐Kind1). Seven days after transfection, the cells were starved overnight and then treated or not with 100 ng/ml EGF for 15 min. The cells were then immunostained with anti‐Kindlin‐1 (green) and anti‐EGFR (red) antibodies and counterstained with DAPI (original magnification: X100). (D) Cellular extracts corresponding to (C) were immunoblotted with anti‐EGFR, anti‐Kindlin‐1, anti‐phosphorylated extracellular signal‐regulated kinase (ERK), anti‐ERK and anti‐GAPDH (loading control) antibodies. (E) BT549 cells were stably transfected with wild‐type Kindlin‐1 (Kind1) or the mutant form of Kindlin‐1 deficient in β1‐integrin binding (AAKind; QW611/612AA mutations). Cell extracts were immunoblotted with anti‐Kindlin‐1, anti‐pERK, anti‐ERK and anti‐actin (loading control) antibodies. (F) MDA‐MB‐468 cells were starved overnight and treated with EGF (100 ng/ml) for the indicated times. Cellular extracts were immunoblotted with anti‐pEGFR, anti‐Kindlin‐1 and anti‐GAPDH antibodies. (G) EGFR and Kindlin‐1 protein expression in 29 breast cancer cell lines from CCLE. Estrogen receptor (ER), progesterone receptor (PR), Her2 status and breast cancer subtype have been reported. (H) Correlation between EGFR and Kindlin‐1 protein levels in CCLE cell lines presented in (G) (Spearman's rank correlation test). (I) Gene set enrichment analysis (GSEA) plot showing the enrichment of the EGFR pathway in CCLE cell lines (n = 58) categorised into high (n = 19) versus low (n = 39) Kindlin‐1 expression groups. FDR, false discovery rate q value; NES, normalised enrichment score
