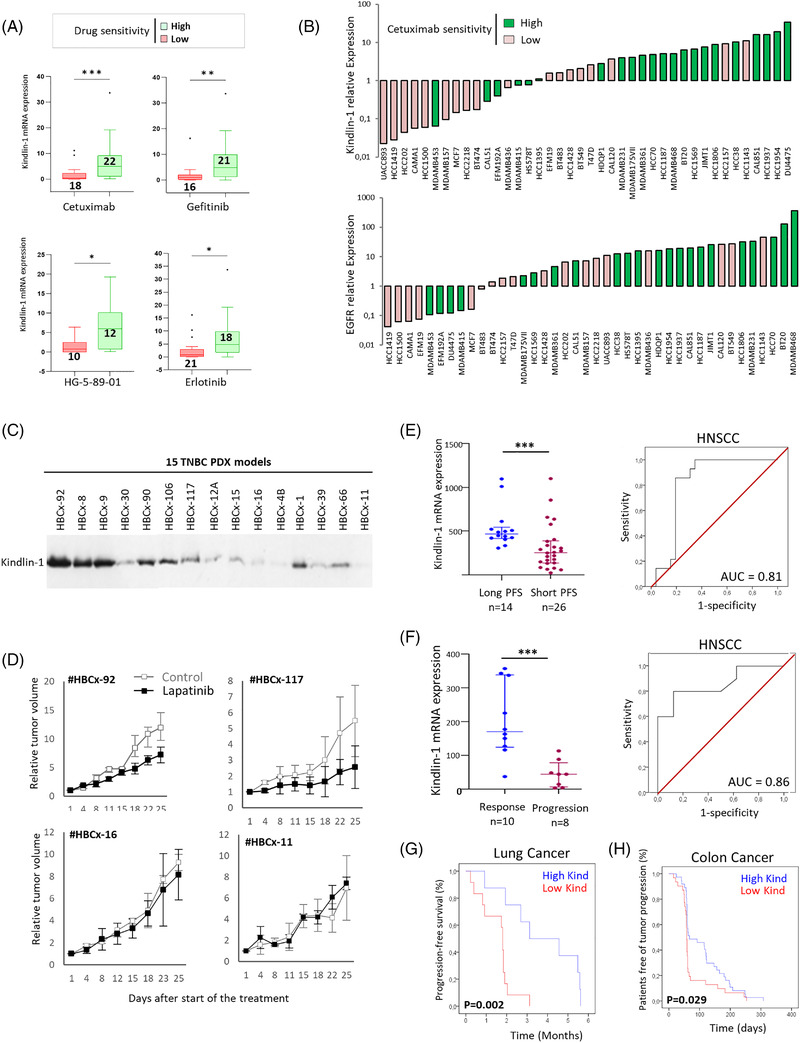
FIGURE 4.

Kindlin‐1 expression is predictive of the response to epidermal growth factor receptor (EGFR) inhibitors. (A) Box and whisker plots representing the differential mRNA expression levels of Kindlin‐1 in breast cancer cells with low versus high sensitivity to cetuximab (P = 00009), gefitinib (P = 0015), HG‐5‐89‐01 (P = 0,02) and erlotinib (P = 0013) (Mann–Whitney test). (B) Relative Kindlin‐1 or EGFR expression in 40 breast cancer cell lines from the CCLE classified into high (n = 22) or low (n = 18) sensitivity to cetuximab depending on their IC50 values as reported in the Genomics of Drug Sensitivity in Cancer database (chi square test, P = 0.001 and P = 0.02, respectively). (C) Western blot showing Kindlin‐1 protein expression in a series of 15 triple‐negative breast cancer (TNBC) patient‐derived xenograft (PDX) models. (D) Graphs showing relative tumour growth after lapatinib treatment of two PDX models highly expressing Kindlin‐1 (#HBCx‐92 and # HBCx‐117) and two PDX models with low Kindlin‐1 expression (#HBCx‐16 and # HBCx‐11). (E) Scatter plot representing the differential mRNA expression levels of Kindlin‐1 in a dataset of 40 HNSCC patients (GSE65021), dichotomised into long (progression‐free survival [PFS] > 12 months, n = 14) and short (PFS < 5.6 months, n = 26) PFS after undergoing first‐line CT and cetuximab‐based combination therapy (Mann–Whitney test, P = 0.0008). Receiver operating characteristic (ROC) curve assessing the performance of Kindlin‐1 in the cohort of 40 head and neck squamous cell carcinoma (HNSCC) patients. (F) Scatter plot representing the differential mRNA expression levels of Kindlin‐1 in a series of 18 HNSCC patients from Institut Curie, dichotomised into response (n = 10) and progression (n = 8) after undergoing cetuximab monotherapy (Mann–Whitney test, P = 0.0008). The ROC curve corresponding to this latter HNSCC cohort resulted in an area under the curve (AUC) of 0.86. (G) Kaplan–Meier plot showing the PFS (%) of 20 non‐small cell lung cancer (NSCLC) cancer patients treated with erlotinib (both EGFR and KRAS wild‐type) from the BATTLE study (GSE33072, log‐rank test). (H) Kaplan–Meier plot showing the patient‐free survival of tumour progression (%) from a series of 68 metastatic colorectal cancer patients enrolled in a cetuximab monotherapy trial (GSE5851, log‐rank test)
