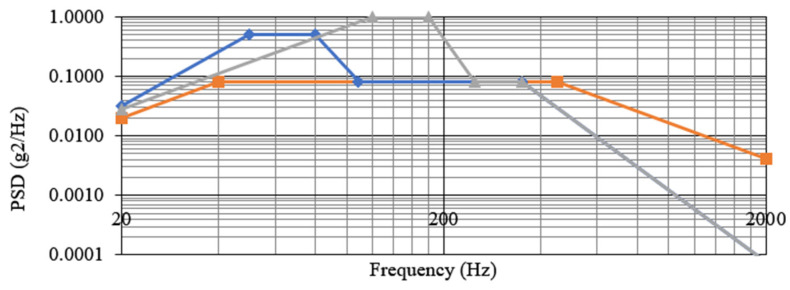
Figure 17.
Random vibration profiles comparison. The orange line represents the initial requirement before isolation and the final profile performed over the shock absorbers with the dummy. The blue line represents the new profile for RDS-alone z-axis testing. Greyline represents the new profile for in-plane testing.

