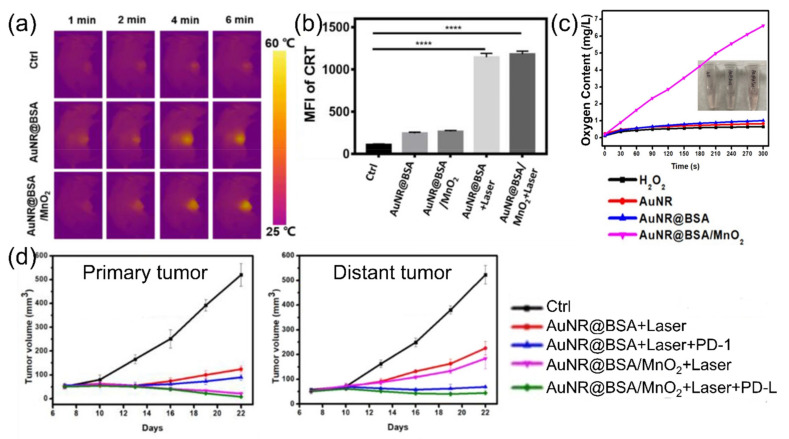
Figure 7.
(a) Thermal images of 4T1 tumor area after laser irradiation; (b) expression of CRT after treatments (**** p < 0.0001); (c) oxygen generation curves from the decomposition of H2O2 in the presence of the PTT agent AuNRs; (d) tumor growth curve of primary and distant tumor after treatments (BSA: bovine serum albumin, PD-1: immune checkpoint blockade). Figures are reproduced from ref. [116] with permission from Wiley-VCH GmbH.

