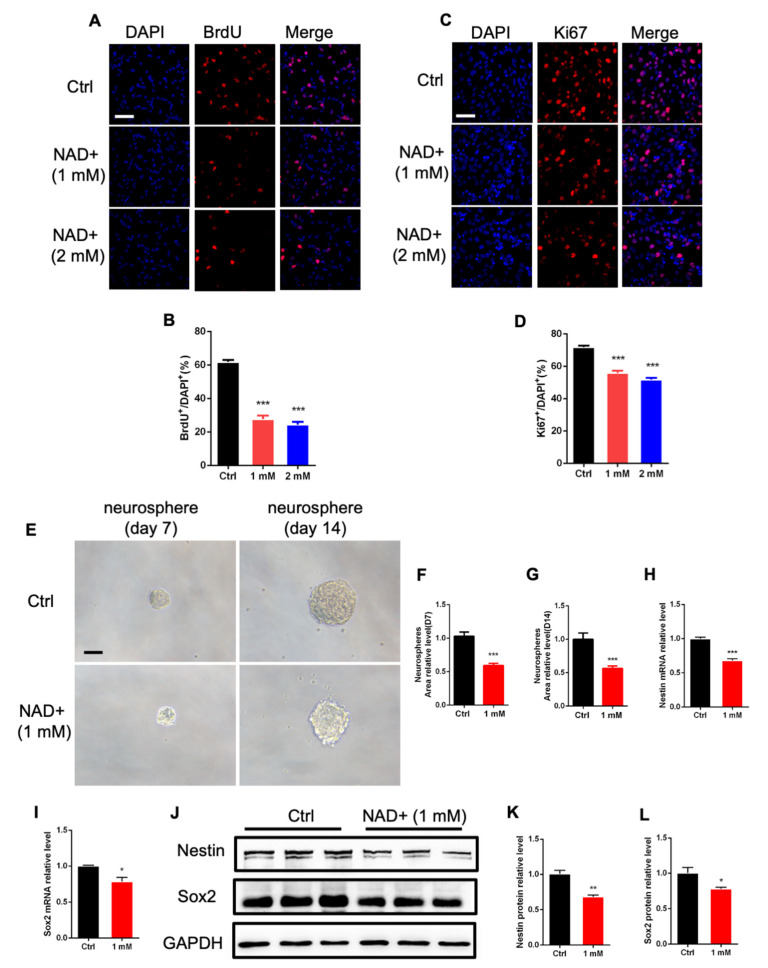
Figure 1.
NAD+ exposure affects the proliferation of adult neural stem/progenitor cells in vitro. (A) Representative images of BrdU immunostaining with control (Ctrl) and NAD+-treated adult neural stem/progenitor cells (aNSPCs). Scale bar, 50 μm. (B) Quantification results show that NAD+ exposure decreased the percentages of BrdU+ cells under proliferation conditions. Data are presented as the mean ± SEM. n = 3 independent experiments, unpaired t-test. (C) Representative images of Ki67 immunostaining with Ctrl and NAD+-treated aNSPCs. Scale bar, 50 μm. (D) Quantification results show that NAD+ exposure decreased the percentages of Ki67+ cells. Data are presented as the mean ± SEM. n = 3 independent experiments, unpaired t-test. (E) Representative images of neurospheres derived from single aNSPCs. aNSPCs were supplemented with 1 mM NAD+ and analyzed at days 7 and 14. Scale bar: 50 μm. (F,G) Quantification results show that NAD+ exposure decreased the size of neurospheres at day 7 (F) and day 14 (G). Data are presented as the mean ± SEM. n = 30 neurospheres for Ctrl and NAD+ exposure groups at each timepoint. unpaired t-test. (H,I) The relative mRNA levels of Nestin and Sox2 of Ctrl and NAD+ supplemented aNSPCs. Data are presented as the mean ± SEM. n = 3 independent experiments, unpaired t-test. (J–L) Western blot assay (J) and quantification results (K,L) show that NAD+ exposure decreased the level of Nestin and Sox2. GAPDH was used as an internal control. Data are presented as the mean ± SEM. n = 3 independent experiments, unpaired t-test; *, p < 0.05; **, p < 0.01; ***, p < 0.001.

