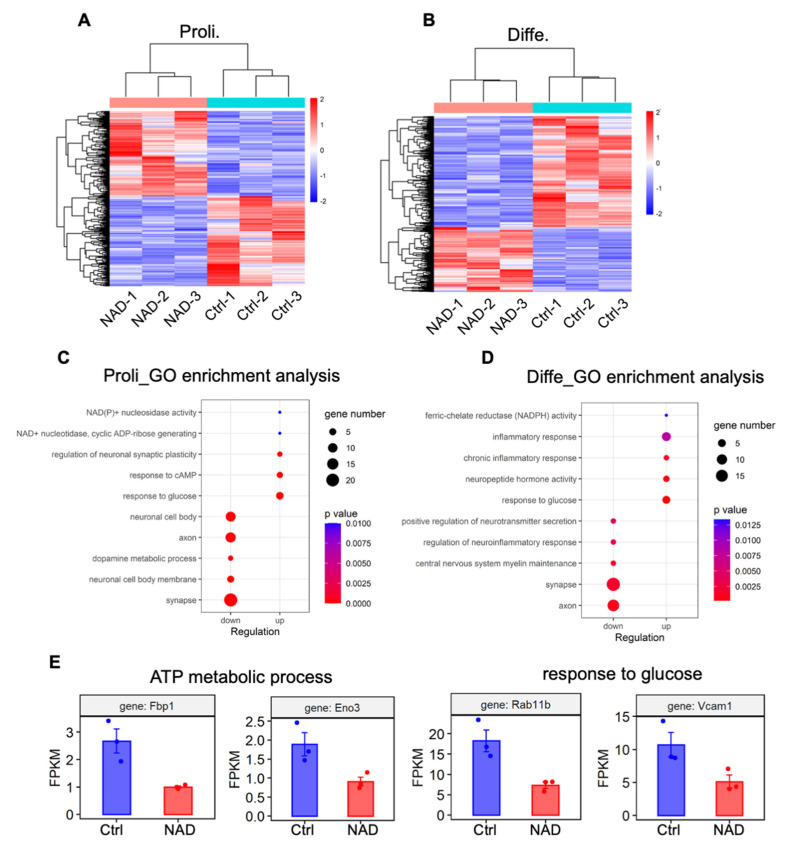
Figure 5.
NAD+ exposure alters the transcriptome of aNSPCs under proliferating and differentiation conditions. (A,B) Heatmap showing the differentially expressed genes (DEGs) in Ctrl and NAD+ exposure groups under proliferating (A) and differentiation (B) conditions. Three biological repeating samples of Ctrl and NAD+ exposure (1 mM) were adopted for RNA sequencing. The significance of expression was determined by the |FC| > 2 and p-value < 0.05. (C) GO enrichment analysis of the up-regulated and down-regulated genes induced by NAD+ exposure (proliferating condition). The significance of expression was determined by |FC| > 2 and p-value < 0.05. (D) GO enrichment analysis of the up-regulated and down-regulated genes induced by NAD+ exposure (differentiation condition). The significance of expression was determined by |FC| > 2 and p-value < 0.05. (E) FPKM values of several genes related to ATP metabolic process and response to glucose.

