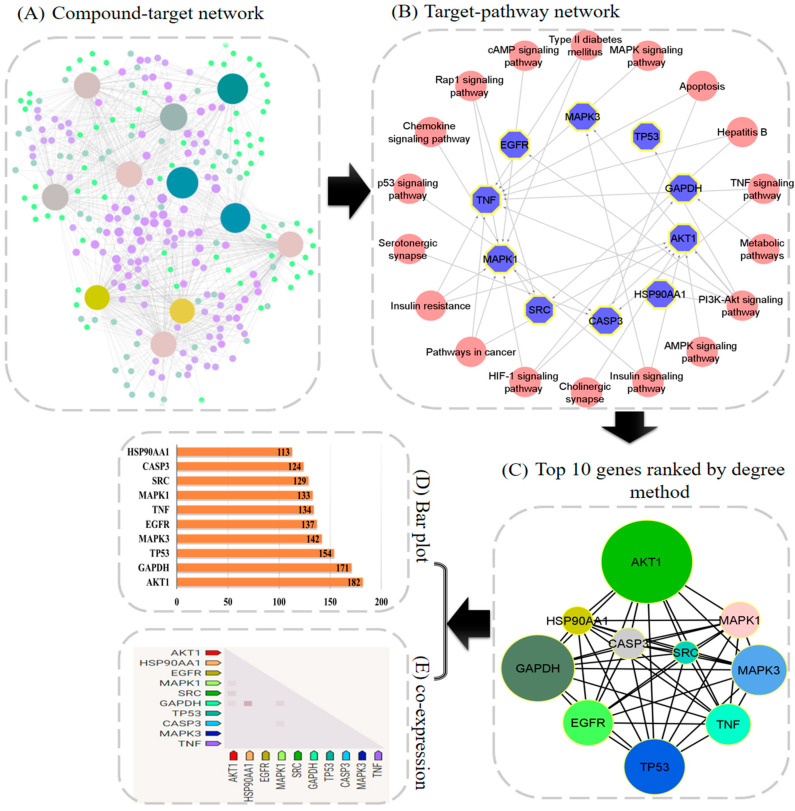
Figure 1.
Network-pharmacology-based analysis of multi-compound, multi-target, and multi-pathway treatment for T2DM. (A) Network diagram of compounds and their targets. (B) Network diagram of target genes–enrichment pathways. The blue octagon indicates the targets, and pink nodes indicate the pathways. (C) Top 10 genes ranked by degree. (D) The bar plot of the PPI network. (E) Observed expression of 10 target genes in Homo sapiens.

