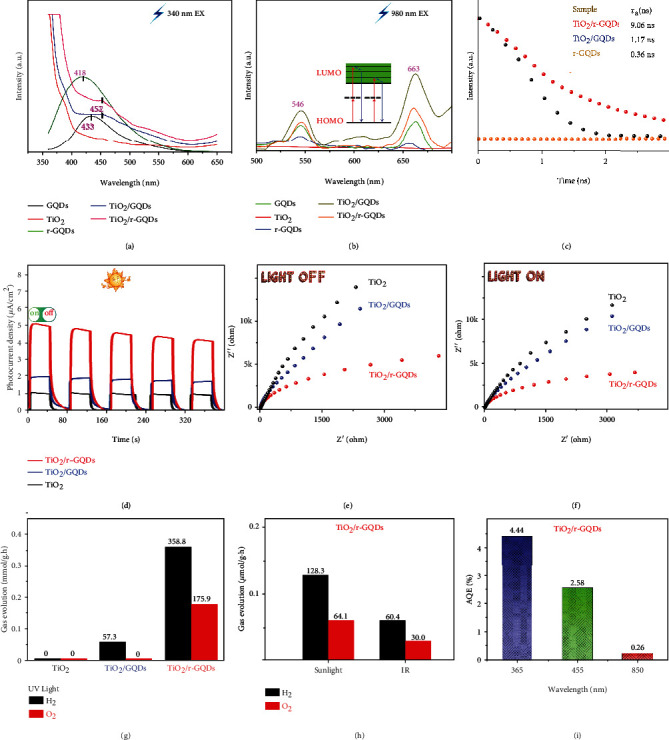
Figure 3.

Charge dynamics behavior and photocatalytic performance. PL spectra of the samples with (a) 340 nm and (b) 980 nm excitation. (c) Fluorescence lifetime spectra, (d) transient photocurrent spectra, and (e, f) electrochemical impedance spectra of the TiO2, TiO2/GQDs, and TiO2/r-GQDs. (g, h) Photocatalytic water splitting performance (UV light: 100 mW cm−2; sunlight: 100 mW cm−2; and IR light: 20 mW cm−2). (i) AQE values of TiO2/r-GQDs under different illumination wavelengths.
