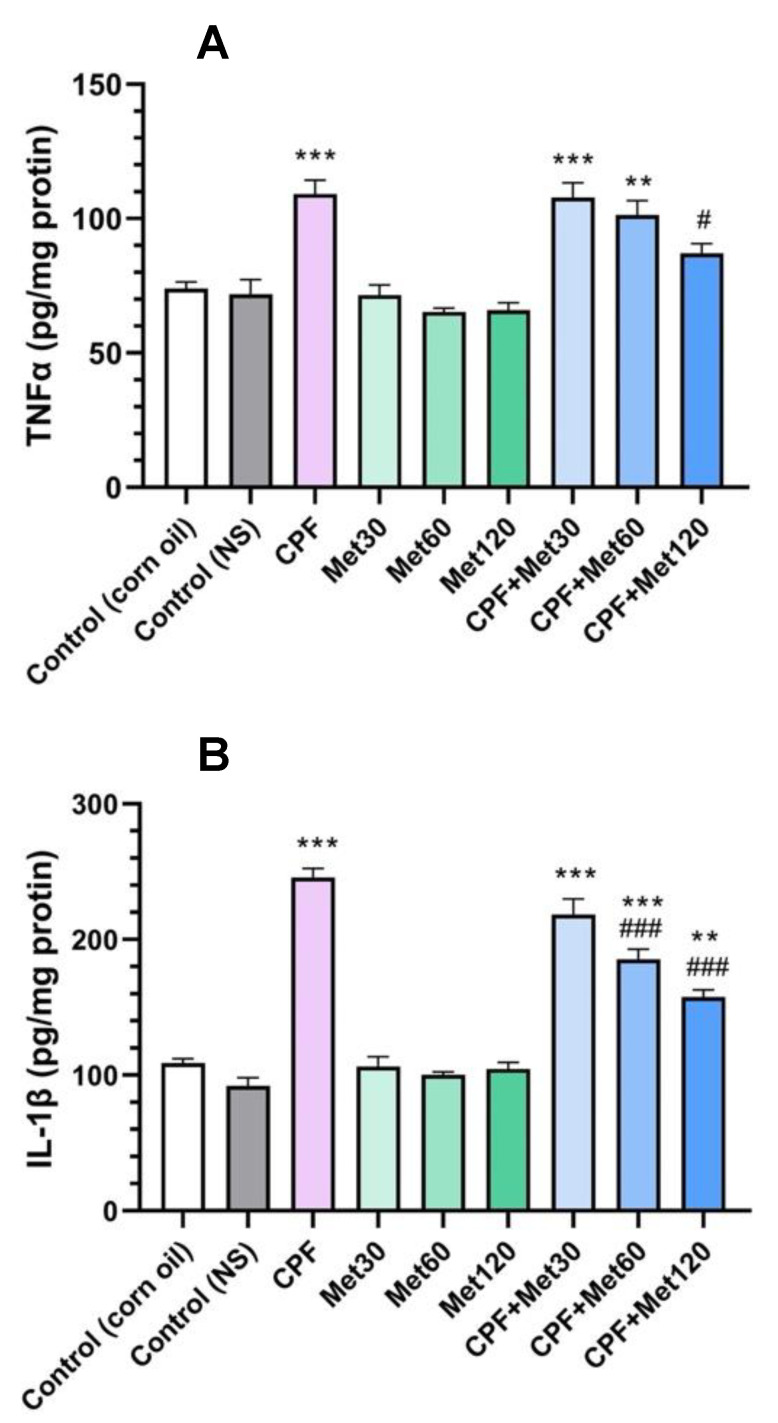
Figure 2.
Results of inflammatory cytokine tests on the brain tissue of 6 Wistar rats in each group. Data were obtained from 4 repeated measurements and are reported as mean ± SEM. (A) Tumor necrosis factor alpha (TNFα) assay. (B) Interleukin 1 beta (IL-1β) assay. ** p-value < 0.005, *** p-value < 0.001; compared with the control groups. # p-value < 0.05 and ### p-value < 0.001; compared with chlorpyrifos (CPF) group.

