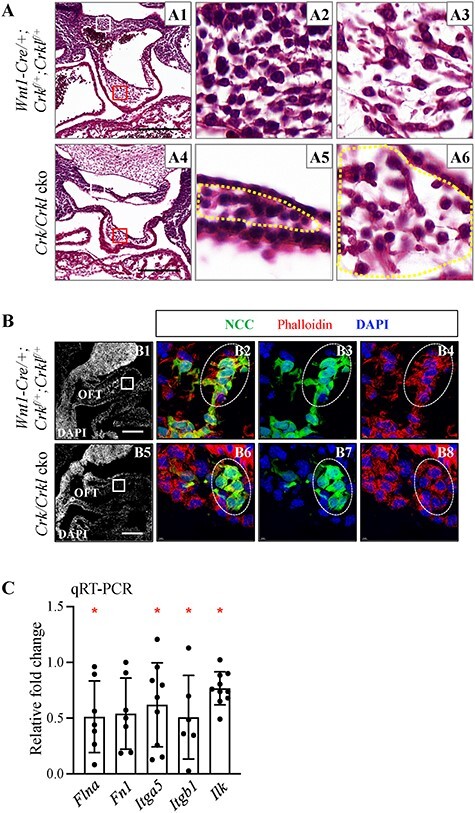
Figure 6.

Altered NCC cell morphology in Crk/Crkl cko versus control embryos at E10.5. (A) Transverse H&E sections from Wnt1-Cre/+; Crkf/+; Crklf/+ (control) (A2, A3) and Crk/Crkl cko (A5, A6) embryos showing more rounded shape in four-allele cko embryos. (A2, A5; A3, A6) are zoomed in images of white or red boxes from (A1) and (A4), respectively. Based on the analysis of NCC distribution using immunofluorescence staining on sections at E10.5, all cells in A2 as well as A5 (cells in region marked by yellow dashes) and most cells in A3 as well as A6 (cells in region marked by yellow dashes) are NCCs. (B) Sagittal immunofluorescence sections stained with anti-GFP antibody and Phalloidin from Crk/Crkl cko and control embryos. (B2–4) and (B6–8) are zoomed in images of white boxes indicated in (B1) and (B5), respectively. Four embryos for each genotype were analyzed in (A, B). PAA4, fourth pharyngeal arch artery. Scale bar: 200 μm. (C) qRT-PCR shows the relative fold change of expression of several Integrin signaling genes in FACS purified NCCs from Crk/Crkl cko versus Wnt1-Cre/+; GFPf/+ embryos. The graph was plotted with mean and standard deviation. Each dot in graphs represents one biological replicate (pooled 4–6 embryos). Two-tailed Student’s t-test was used for the statistical analysis. *: 0.01 < P < 0.05.
