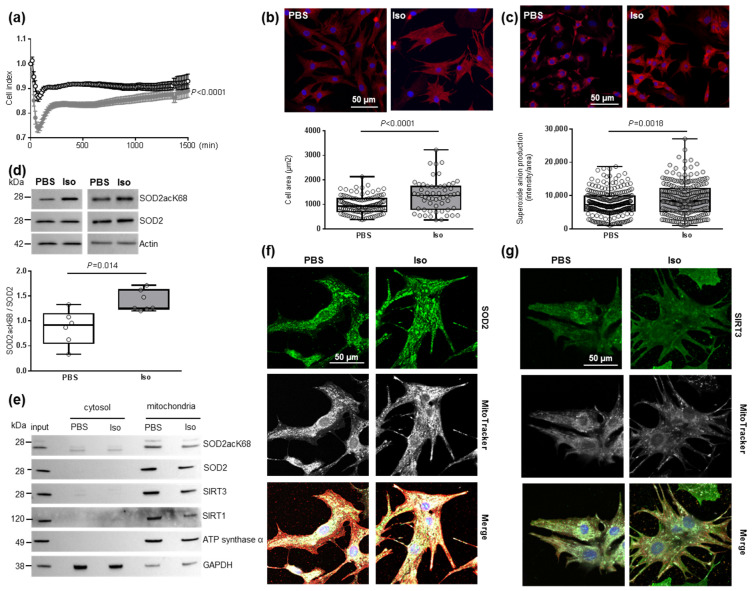
Figure 1.
Characterization of mitochondrial oxidative stress in hypertrophied neonatal rat cardiomyocytes (NCMs). (a) Cell index quantification in untreated (black line) and Isoproterenol (Iso)-treated (gray line) NCMs by RTCA analysis. Cell index was recorded every 15 min (n = 4 independent isolation, in duplicate). (b) Hypertrophy was quantified in untreated- (PBS) (white box) or Iso-treated (gray box) NCMs for 24 h by immunofluorescence of alpha-actinin (red) and nuclei (blue) (top panels) and quantification of cell area (µm2) (bottom panel) (from 3 independent experiments and at least 273 cells). Oxidative stress was quantified in untreated (PBS) or Iso-treated NCMs for 24 h by fluorescence quantification of (c) mitochondrial superoxide anion with mitoSOX probes (red) (from 3 independent experiments and at least 236 cells) and by Western blot of (d) SOD2 acetylated on lysine 68 (SOD2acK68) or lysine 122 (SOD2acK122) on SOD2 ratio normalized to actin. (e) Representative images of SOD2acK68, SOD2 and sirtuins localized in mitochondria (validated by ATP synthase α) after subcellular fractionation of untreated (PBS) or Iso-treated-NCMs for 24 h. Representative images of (f) SOD2 (green) and (g) SIRT3 (green) localized in mitochondria (white) of untreated (PBS) or Iso-treated NCMs for 24 h. Colocalization appeared in merged images. Only significant p values are indicated from at least 3 independent experiments. Images were selected to represent the mean values of each condition.

