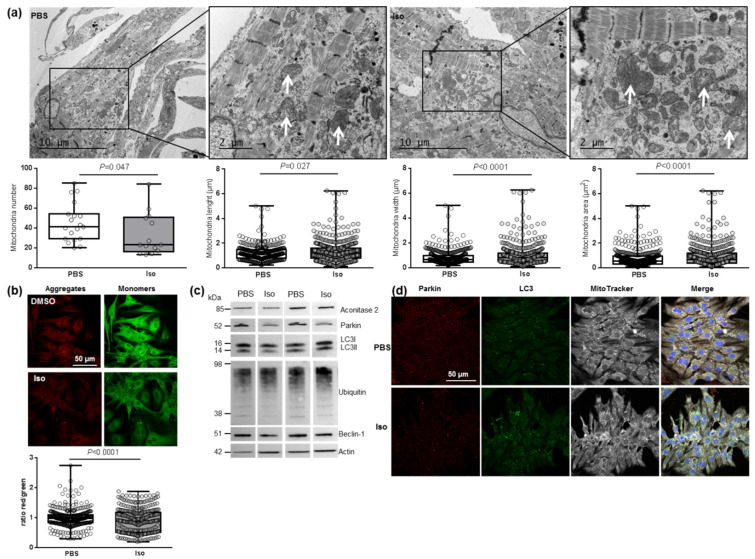
Figure 4.
Characterization of mitochondrial function and autophagy/mitophagy in hypertrophied neonatal rat cardiomyocytes (NCMs). (a) Ultrastructure of PBS- and Iso-treated NCMs (magnification ×7000 with a scale bar of 10 µm (left images) and ×12,000 with a scale bar of 2 µm (right images)) and quantification of mitochondria number, length (µm), width (µm) and area (µm2). Arrows indicate example of mitochondria for comparison. (b) Mitochondrial membrane potential was quantified in NCMs treated with Iso by fluorescence quantification of JC-1 dye for aggregates (red) and monomer (green) (from 3 independent experiments and at least 366 cells). (c) Representative images for quantification of Krebs cycle by Western blot of aconitase 2 and mitophagy/autophagy by Western blot of parkin, LC3II/LC3I ratio, ubiquitin and beclin-1 in NCMs treated with Iso Data were normalized to actin. (d) Representative images of parkin (red) and LC3 (green) localized in mitochondria (white) of untreated (PBS) and Iso-treated NCMs. Colocalization appeared in merge images. Nuclei were stained by Dapi (blue). Only significant p values are indicated from at least 3 independent experiments. Images were selected to represent the mean values of each condition.

