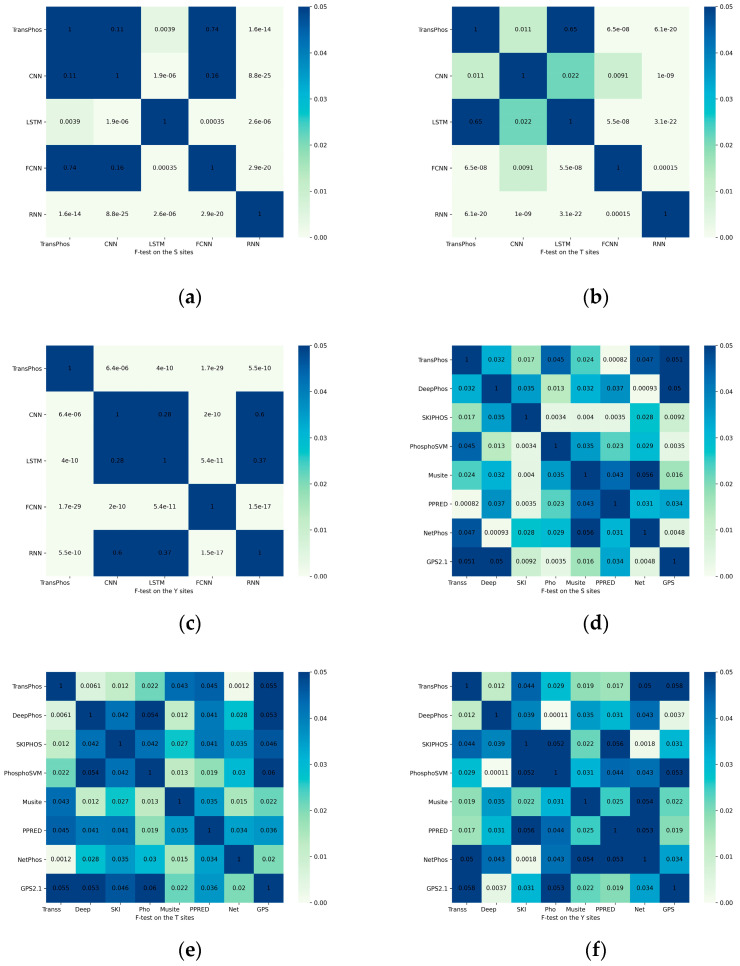
Figure 2.
Heat map of the significance F-test, the value of each square in the graph is the p-value of the statistical test, and it is generally accepted that a p-value less than 0.05 means that the 2 statistics are significantly different. Here we use scientific notation, for example 1.6e-14 means . All statistical tests were performed on the predicted results of the test dataset PPA. In the horizontal coordinates, the names of some models are abbreviated to show them in full. (a) Significance F-test of the prediction results between the deep learning models for the S sites. (b) Significance F-test of the prediction results between the deep learning models for the T sites. (c) Significance F-test of the prediction results between the deep learning models for the Y sites. (d) Significance F-test of the prediction results for the S sites between other prediction models. (e) Significance F-test of the prediction results for the T sites between other prediction models. (f) Significance F-test of the prediction results for the Y sites between other prediction models.

