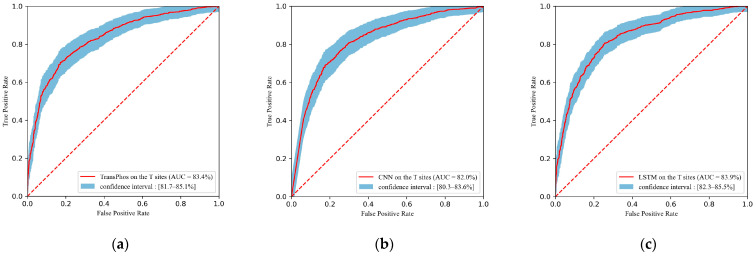
Figure A1.
ROC curves containing 95% confidence intervals for different deep learning models on the T sites of the training dataset P.ELM, 10-fold cross validation was used. (a) ROC curve of the TransPhos model; (b) ROC curve of the CNN model. (c) ROC curve of the LSTM model. (d) ROC curve of the RNN model. (e) ROC curve of the FCNN model. (f) Performance comparison on the T sites of the P.ELM dataset.


