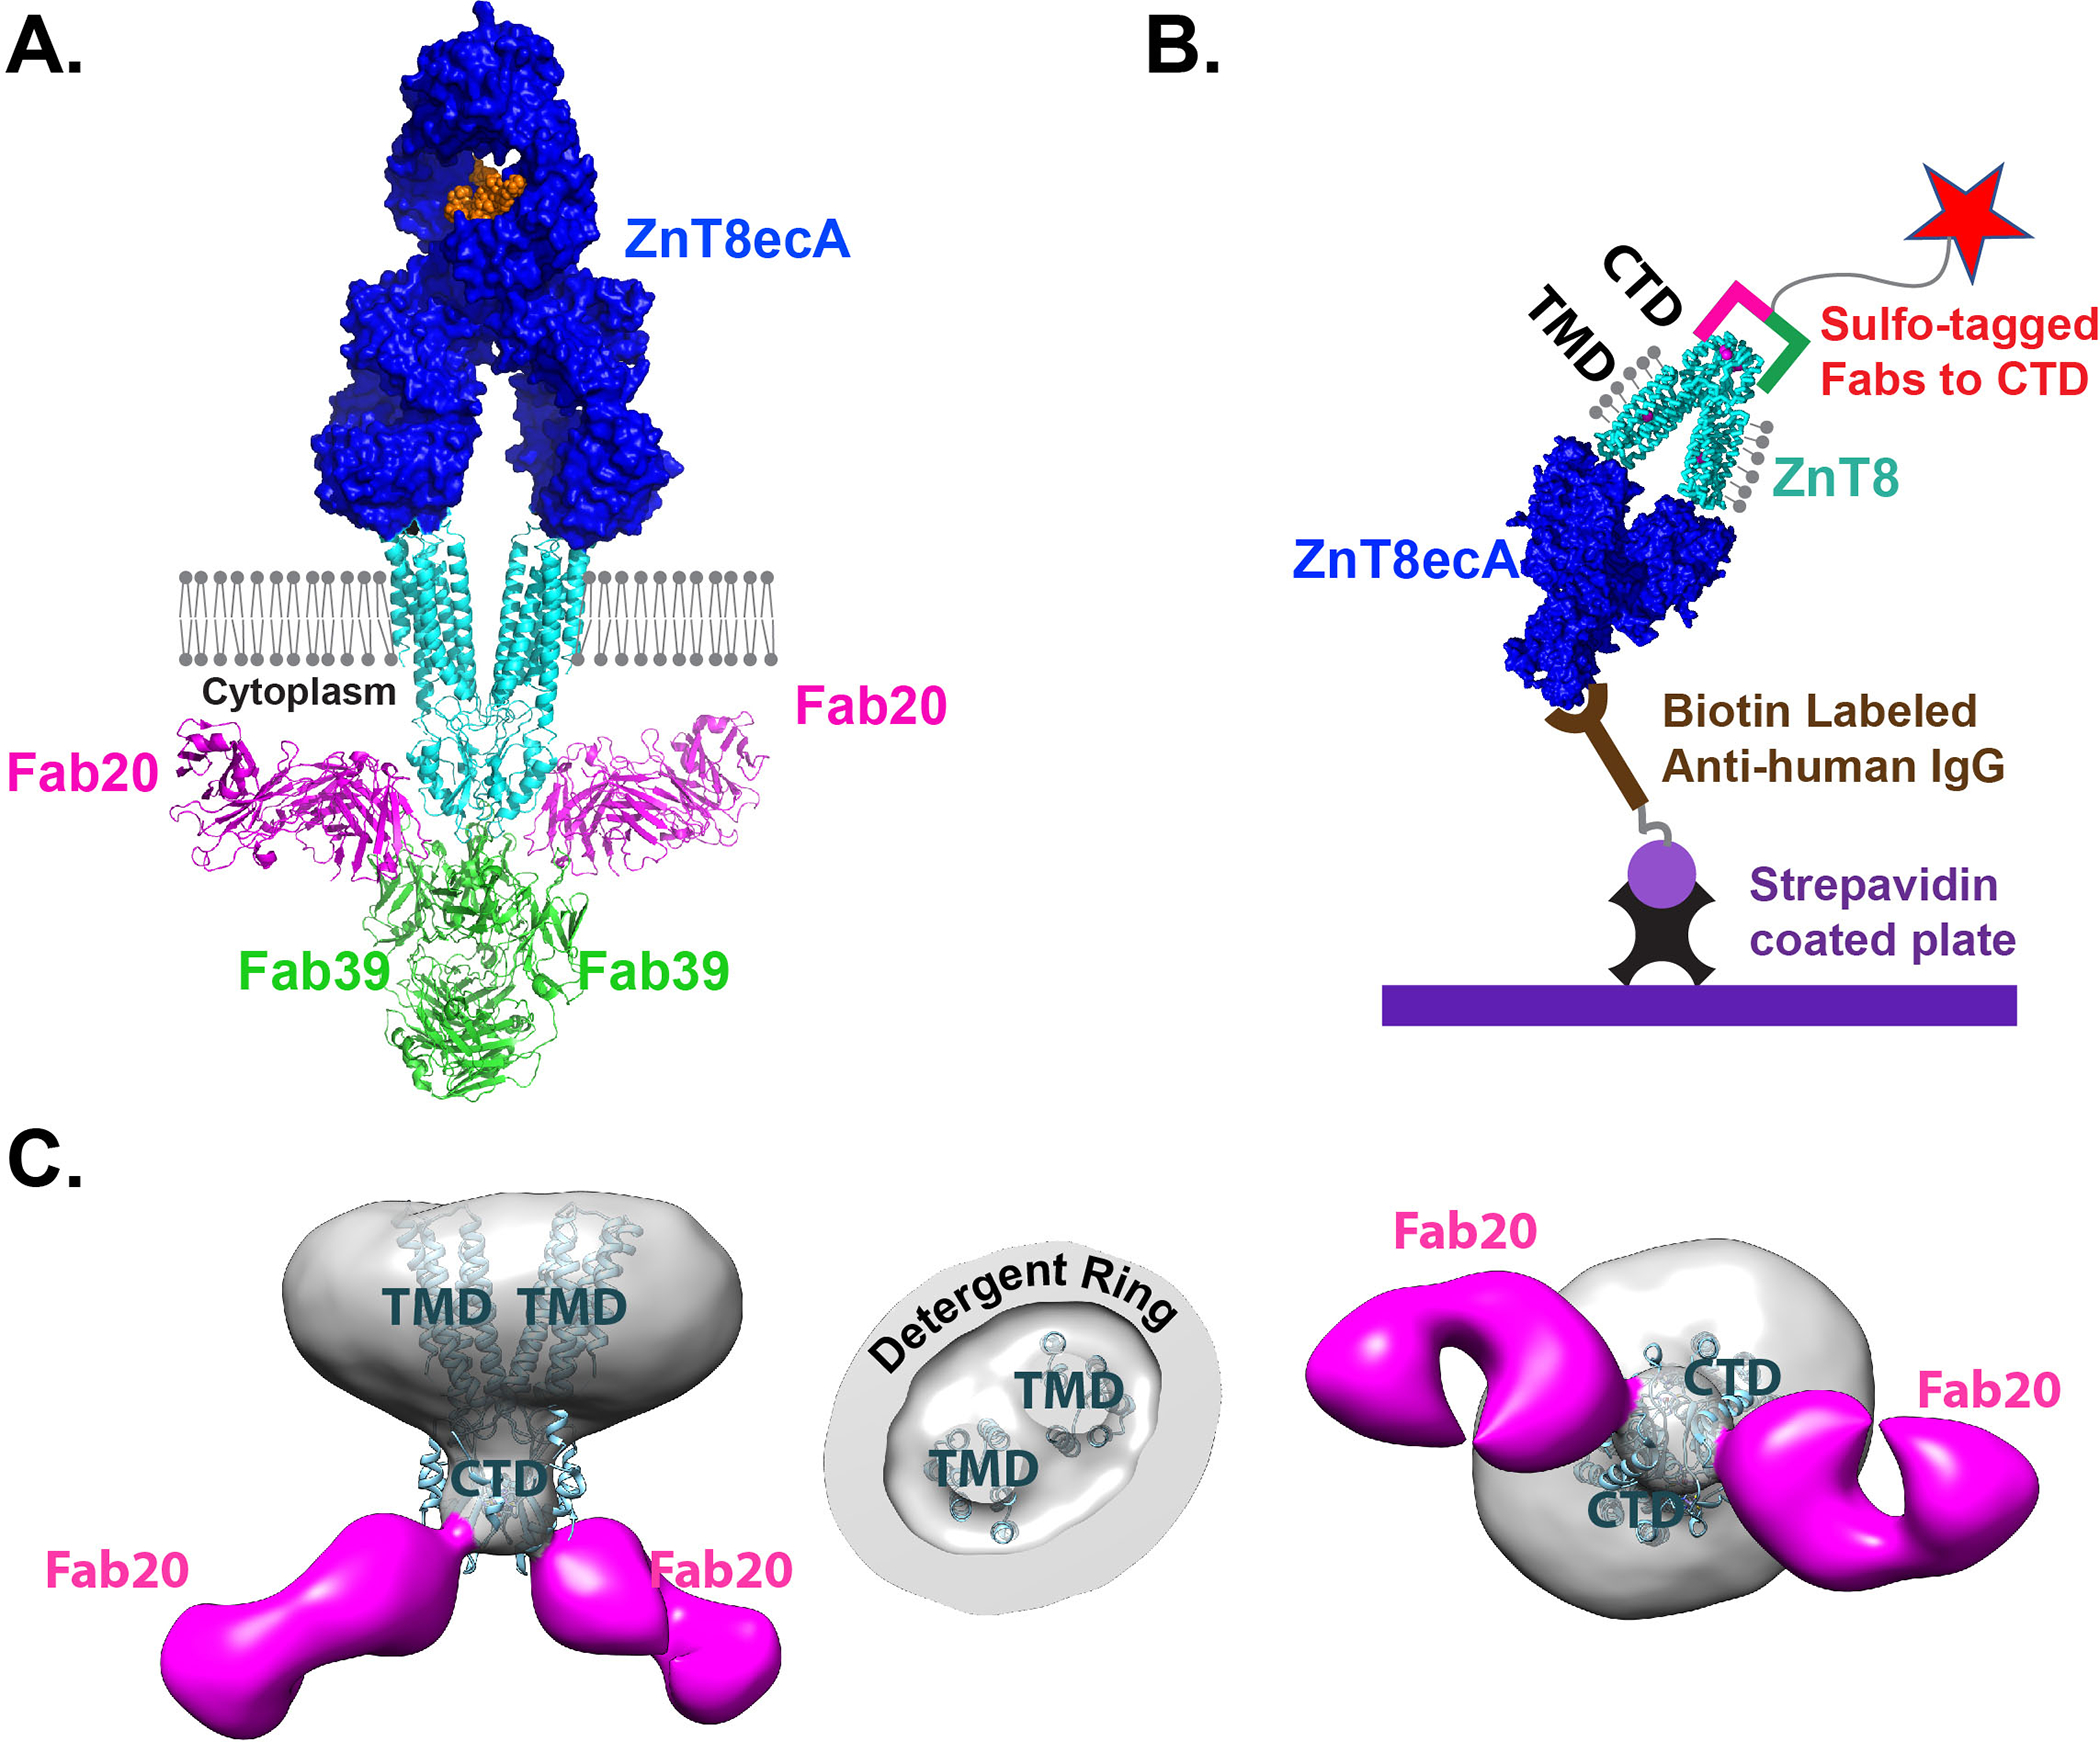
Fig. 1. ZnT8ecA assay on the ECL platform.

A. ZnT8ecA binding to the cell surface and a structural model of ZnT8ecA-ZnT8-Fab20-Fab39 complex in relation to the surface membrane (grey balls and sticks). Proteins are drawn in 1:1 scale in cyan for a ZnT8 homodimer, magenta for Fab20, green for Fab39, blue for a ZnT8ecA in surface representation, and orange for antibody glycosylation. B. Schematic diagram of the ECL-assay. ZnT8 was solubilized by detergent (grey balls and sticks), stabilized by Fab (magenta/green bars) conjugated with a sulfo-tag (red star), and captured by a biotinylated anti-IgG secondary antibody via ZnT8ecA binding. C. Electron densities of a ZnT8-Fab20 complex with side view, cut-through view of TMDs, and bottom view from the cytoplasmic side. Cyan ribbons are fittings of a human ZnT8 cryo-EM structure to the electron density map.
