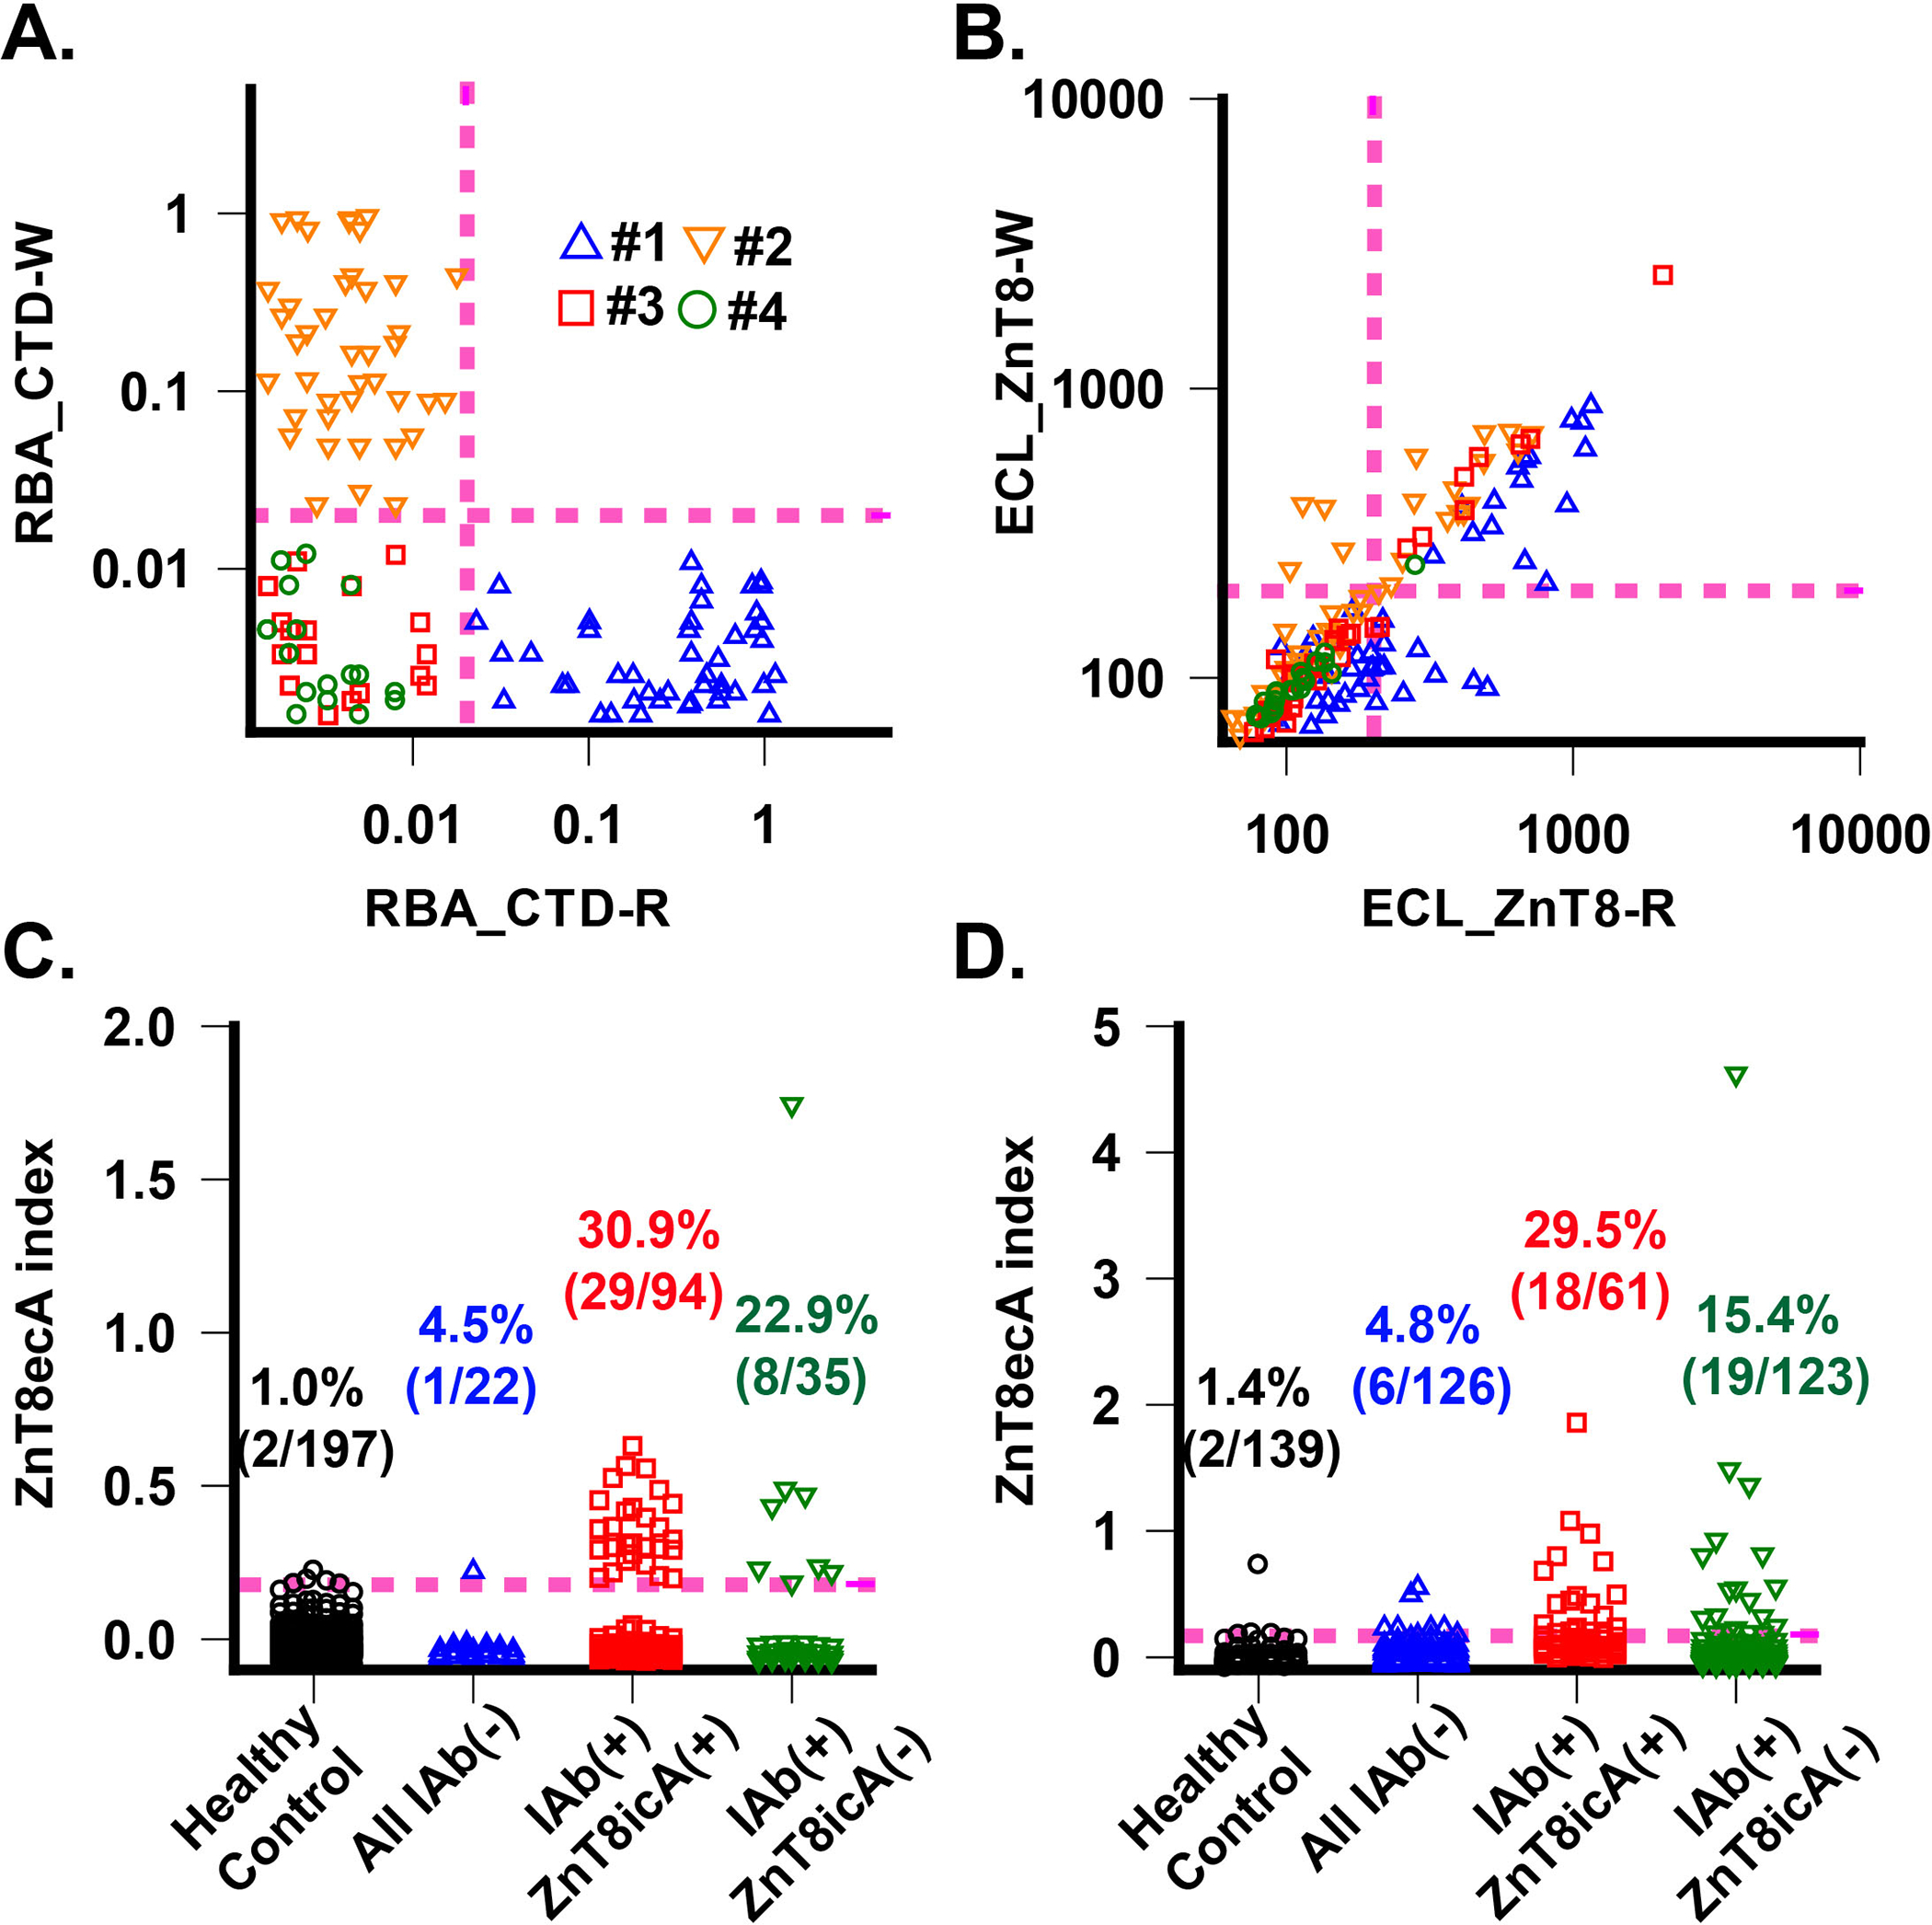
Fig. 2. Detection and validation of ZnT8eAb.

A. ZnT8icA by CTD radio-binding assay. ZnT8AicA levels in each serum were measured against CTD-R and CTD-W variants. Datapoints were obtained from fours cohorts of patients with T1D: #1: 49 R-sera with ZnT8icA(+); #2: 45 W-sera with ZnT8icA(+); #3:35 ZnT8icA(–) but other IAb positive; #4: 22 all IAb negative. Magenta dashed lines indicate assay positivity cut-off. B. Cross-reaction of ZnT8ecA to ZnT8-R and ZnT8-W. ZnT8ecA levels in each serum were measured against ZnT8-R and ZnT8-W variants in complex with Fab20 and Fab39. Identical patient cohorts were used in A. Note, diagonal datapoints indicate R/W cross-reactivity. C. ZnT8ecA positivity in first set of diabetic patient cohorts. The healthy control group was used to determine a positivity cutoff level corresponding to 99% of 197 healthy subjects (magenta dashed line). Diabetic patients were divided into all IAb negative group and IAb positive group, which was further divided into ZnT8icA(+) and ZnT8icA(–) subgroup. D. ZnT8ecA positivity in second set of diabetic patient cohorts. The healthy control group was used to determine a positivity cutoff level corresponding to 99% of 139 healthy subjects (magenta dashed line).
