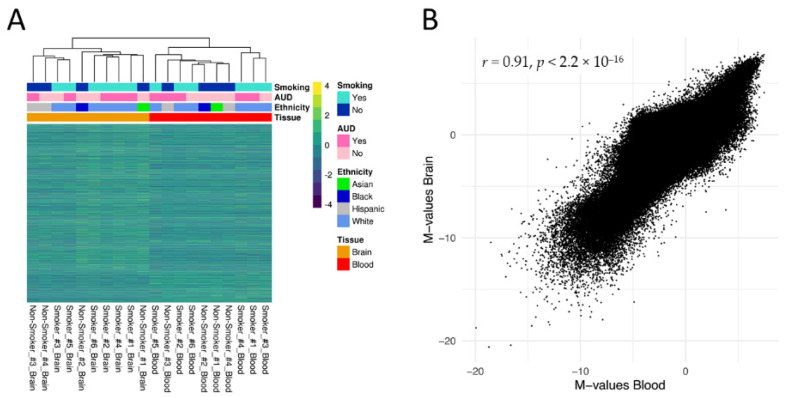
Figure 2.
(A) Hierarchical clustering of matched blood and Brodmann Area 9 (BA9) brain samples (n = 10) based on methylation M-values (row normalized) of the n = 632,086 CpG sites remaining after quality control. Next to the tissue type, smoking status, alcohol use disorder status and ethnicity are displayed as additional phenotypic variables. (B) Pearson correlation of mean M-values in the between-subject correlation analysis using matched blood and BA9 brain samples.

