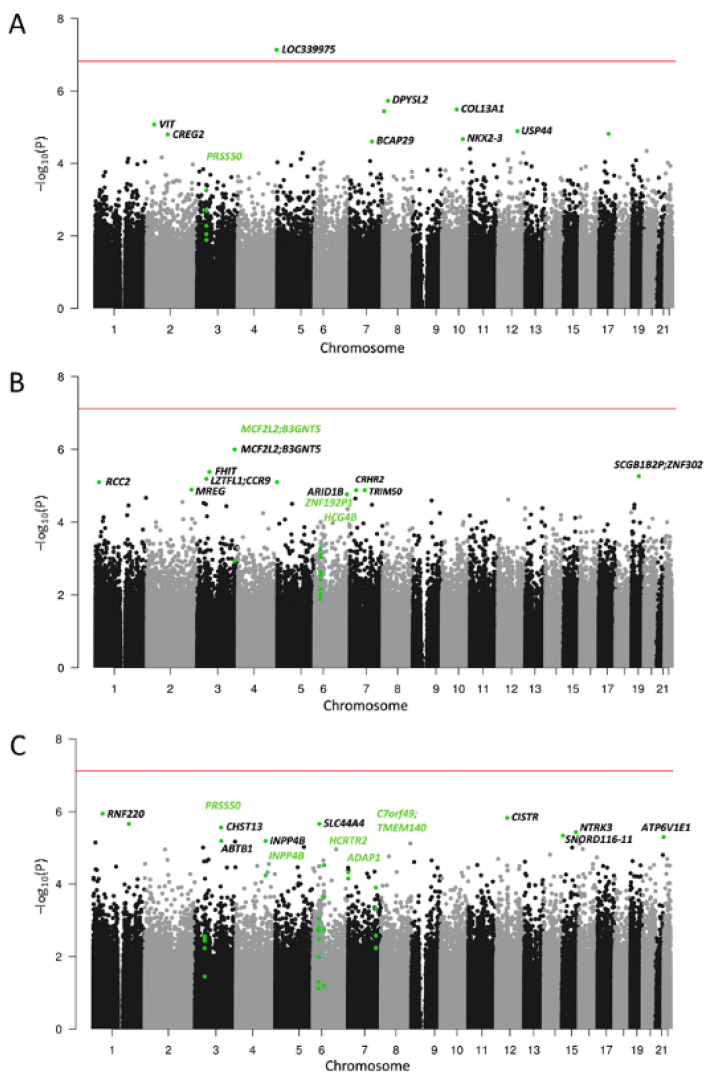
Figure 3.
Manhattan plots for the EWAS of smoking in (A) anterior cingulate cortex (ACC), (B) Brodmann Area 9 (BA9), and (C) the ventral striatum (VS). Top 10 smoking-associated CpG sites for each region and CpG sites contributing to differentially methylated regions (DMRs) are highlighted in green. Annotation to gene names was performed where possible. Names of genes harboring a DMR are highlighted in green. The horizontal line depicts epigenome-wide significance (5% FDR, for further information, see Supplementary Table S3).

