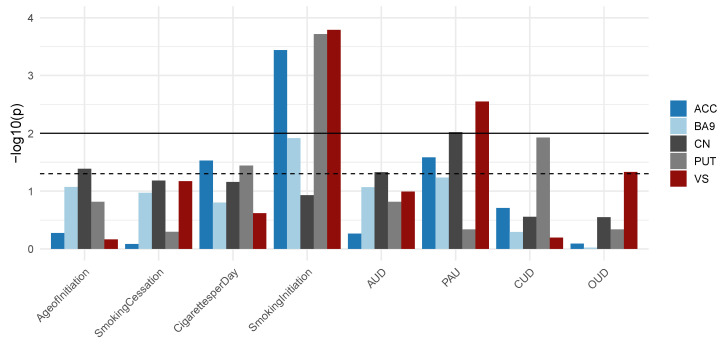
Figure 4.
Summary of the results from GWAS enrichment analysis. For each brain region and each GWAS, the statistical significance of enrichment is shown. Dashed line represents nominal significance (p < 5 × 10⁻²) while the solid line depicts the significance threshold after Bonferroni correction for multiple testing (n = 8, p < 6.25 × 10⁻³). AUD, alcohol use disorder; PAU, problematic alcohol use; CUD, cannabis use disorder; OUD, opioid use disorder.

