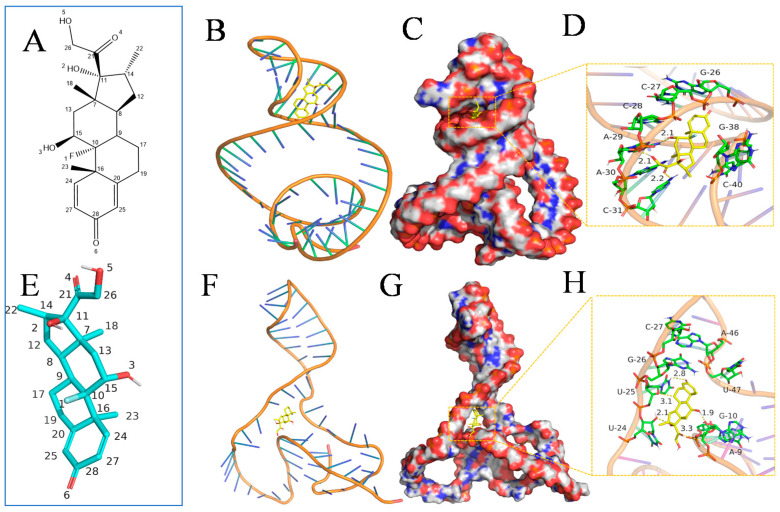
Figure 2.
The atomic number of the DEX (A,E). The binding mode of the aptamer with DEX after MOE-Docking (B). The 3D structure of the complex (C). The electrostatic surface of the aptamer (D). The binding mode of the aptamer with DEX after MD (F). The 3D structure of the complex (G). The electrostatic surface of the aptamer, showing the detail binding mode of aptamer with DEX. The yellow dash represents the hydrogen bond (H).

