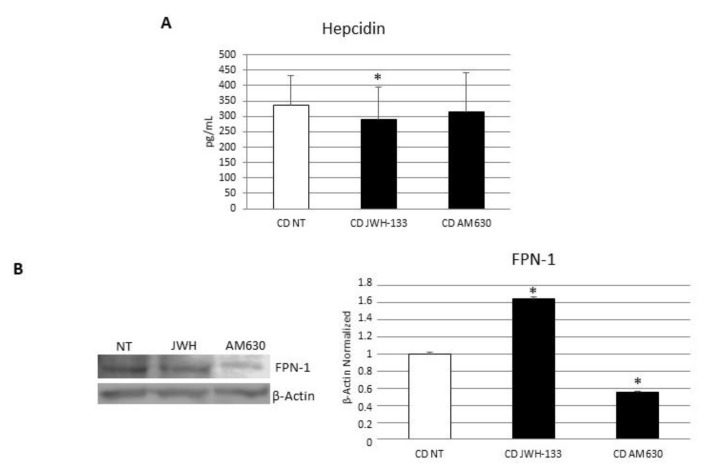
Figure 6.
Effects of CB2 modulation on CD macrophages iron metabolism. (A) Hepcidin concentrations (pg/mL) in macrophages from 5 CD patients after 48 h JWH-133 [100 nM] and AM630 [10 µM] administration determined by ELISA Assay. Histogram shows Hepcidin concentration as the mean ± S.D of independent experiments on each individual sample. The cytokine concentration was determined on a standard concentration curve according to the manufacturer’s instructions. (B) Ferroportin (FPN-1) protein expression, determined by Western Blot, loading 15 μg of total lysate, in macrophages from 5 CD patients after JWH-133 [100 nM] and AM630 [10 µM] administration for 48 h. The most representative images are displayed. The intensity ratios of immunoblots compared to CTR, considered 1, were quantified after normalizing with respective controls. The histograms represent the relative quantification for FPN-1 expression, normalized for the housekeeping protein β-Actin, as mean ± SD of independent experiments on each individual sample. A t-test has been used for statistical analysis. * Indicates p ≤ 0.05 compared to NT.

