Figure 5.
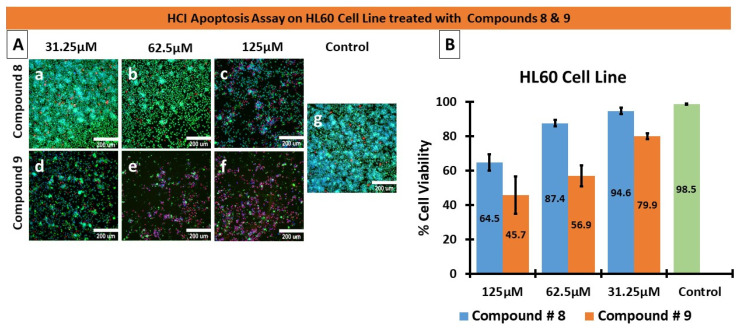
HCI-based apoptosis assay. (A) HL60 cells were treated with three concentrations (31.25 µM, 62.5 µM, and 125 µM) of compounds # 8 (a–c), # 9 (d–f), and PBS for the negative control (g) for 48 h. The nucleus (blue) was stained with HOECHST 33342, the cytoplasm (Green) was stained with Calcein AM, and dead cells (Red) were stained with Propidium Iodide (PI). Compound # 9 was more potent than compound 8, indicated by the presence of dead cells (red) and diminished Calcein AM (Green) staining. (B) HCI Cell Health Digital Analysis MetaXpress software generated the graph quantifying the cell viability, seen in B, as a percentage of HL60 cells treated with the compounds. At low concentrations of 31.25 µM, compound 9 displayed approximately 20% cytotoxic efficacy and approximately 54% cytotoxicity at 62.5 µM concentrations.

