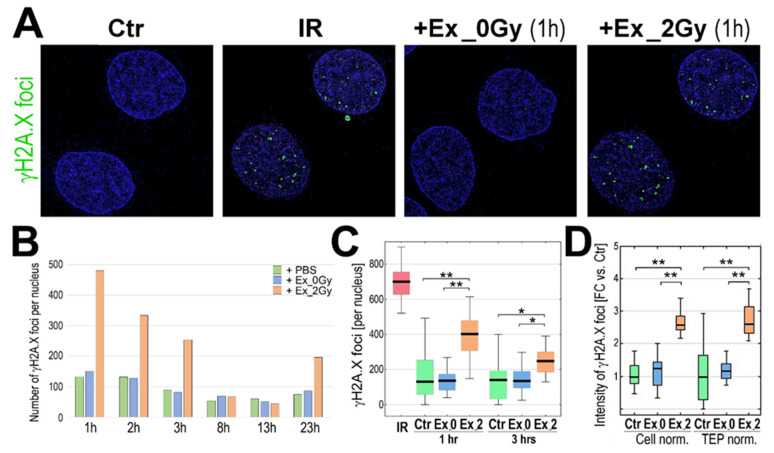
Figure 2.
Induction of γH2A.X foci by exosomes from irradiated cells. (A) Visualization of γH2A.X foci in FaDu cells co-incubated (1 h) with exosomes released by sham-irradiated (Ex_0Gy) or irradiated (Ex_2Gy) cells; untreated cells (PBS control, Ctr) or cells directly irradiated with 2Gy (IR) were used as controls. (B) The number γH2A.X foci after different times of co-incubation with exosomes (1–23 h). (C) The number γH2A.X foci after 1 and 3 h of co-incubation with exosomes; directly irradiated cells (IR) were analyzed 1 h after irradiation. (D) The relative intensity of γH2A.X foci after 1 h of co-incubation; the number of Ex_0Gy and Ex_2Gy exosomes were normalized according to the number of donor cells (Cell norm.) or according to the total exosome proteins (TEP norm.); the nucleus-integrated intensity was expressed as a fold-change versus PBS-treated controls (FC vs. Ctr). Box plots show the median, minimum, maximum, and lower and upper quartiles; statistically significant differences between groups are represented by asterisks: * p < 0.05 and ** p < 0.001 (only differences between Ctr and exosome-stimulated cells are shown for clarity).

