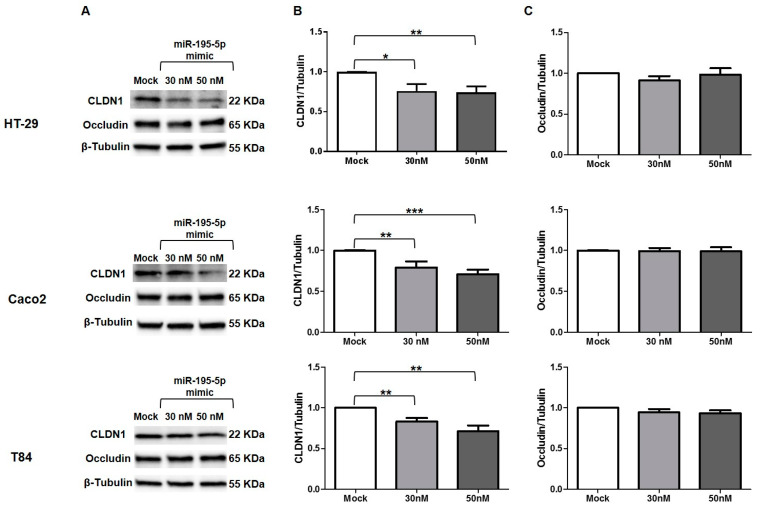
Figure 6.
CLDN1 and Occludin protein expression after miR-195-5p mimic transfection. (A) Representative blots of CLDN1 and occludin protein expression in three IECs cell lines, HT-29, Caco2, and T84 after transfection. Western blot quantitative analysis demonstrated inhibition of CLDN1 (B) but not occludin (C) in all cell lines, after miR-195-5p mimic transfection at 30 and 50 nM. Mock represents cells which have undergone transfection without miRNA mimic. Raw data of the independent experiments of Western blot were reported in Appendix A. Data were obtained by dividing the normalized transfected sample values to normalized mock-control sample values. β-Tubulin was used as housekeeping protein to normalize the data. Data are representative of four independent experiments. The histograms correspond to mean ± SEM. * p < 0.05; ** p < 0.01, *** p < 0.001.

