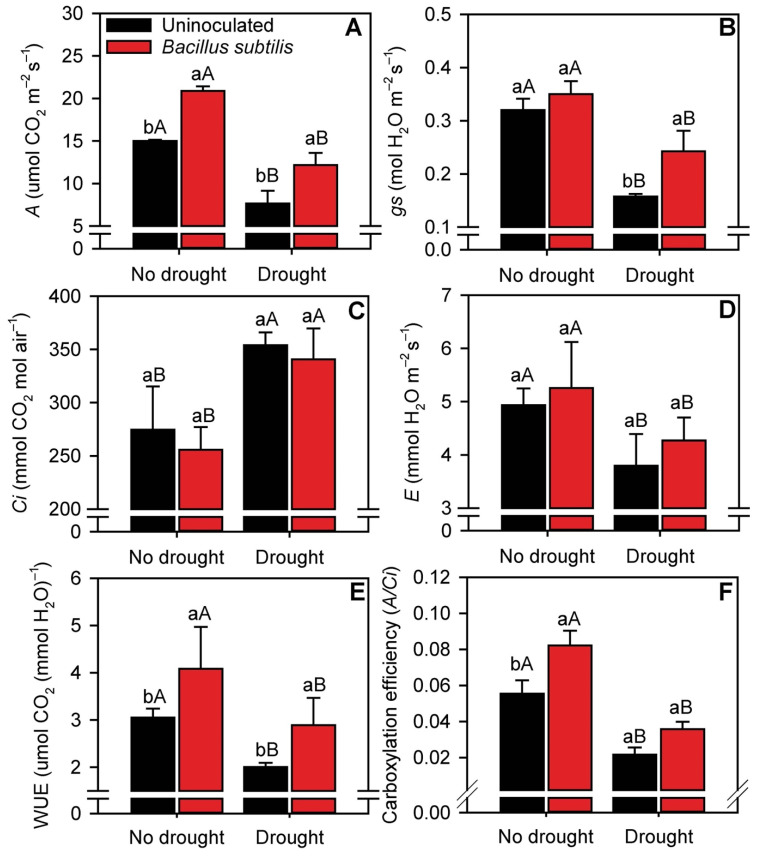
Figure 4.
Net photosynthetic rate (A) (A), stomatal conductance (gs) (B), internal CO2 concentration (Ci) (C), leaf evapotranspiration (E) (D), water use efficiency (WUE) (E), and carboxylation efficiency (F) in sugarcane leaves in the different treatments. Columns with different capital letters indicate significant differences between the presence and absence of water restriction, and columns with different lowercase letters indicate significant differences between the presence and absence of B. subtilis inoculation, by Fisher’s protected LSD test at p ≤ 0.05. Error bars express the standard error of the mean (n = 4).

