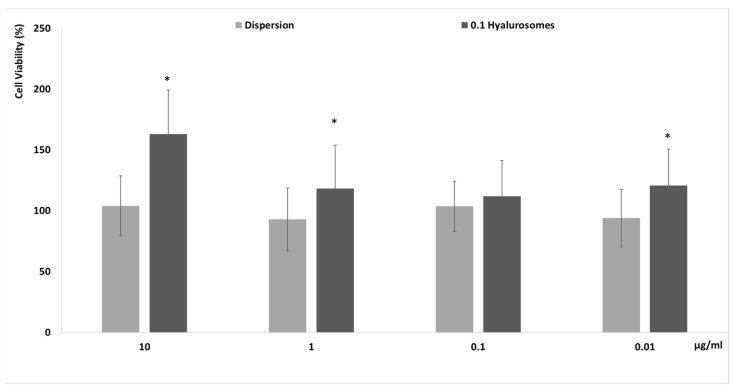
Figure 2.
Cell viability of fibroblasts treated for 48 h with extract in dispersion or loaded in hyalurosomes diluted to reach 10, 1, 0.1, 0.01 μg/mL of extract. Data are reported as mean values (n = 9) ± standard deviations (error bars) of cell viability expressed as the percentage of untreated cells (100% of viability). Symbol (*) indicates that the viability of cells treated with 0.1 hyalurosomes is statistically different from that of cells treated with the extract in dispersion (p < 0.05).

