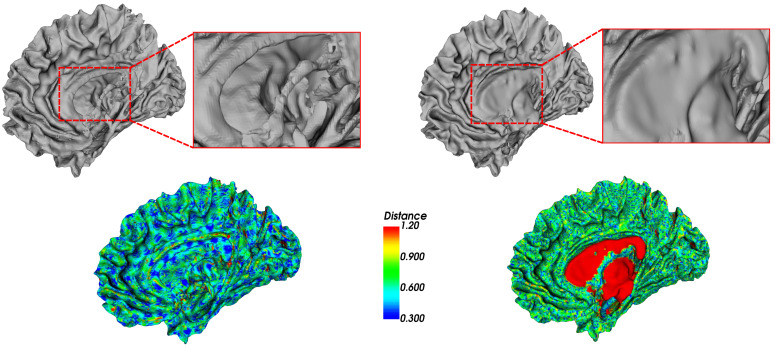
Figure 10.
Visualization of the white matter surfaces reconstructed with our hybrid on the left side and FreeSurfer on the right side. For each reconstruction method, on the top, a 3D view is shown, with a zoom on the red rectangle of the reconstruction result. On the bottom, the surfaces are color-coded with the absolute distance to the segmentation from blue (small distance) to red (high distance) using the Hausdorff metric.

