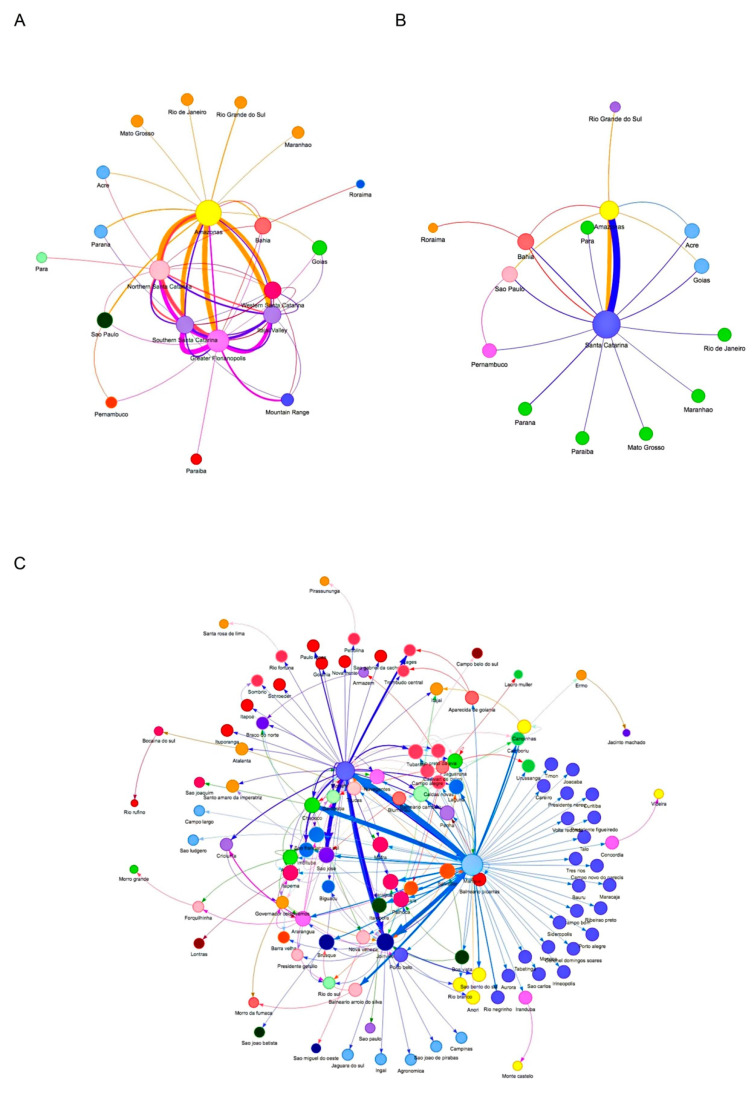
Figure 7.
Network analysis of VOC Gamma and related lineages sequenced in the state of Santa Catarina, Brazil, from 3rd January 2020 to 30th April 2021 with the other Brazilian states. The ML analysis was performed on 13,018 Brazilian VOC Gamma-related genomes obtained from GISAID until 30th April 2021 and submitted to StrainHub [34] analysis considering the closeness parameter. The sizes of the nodes are scaled by the closeness metric and the arrows reflect the directionality of possible transmissions among the Brazilian states (A), Santa Catarina mesoregions (B), and Santa Catarina cities (C). The thickness of the lines and arrows represents the frequency of putative transmissions.

