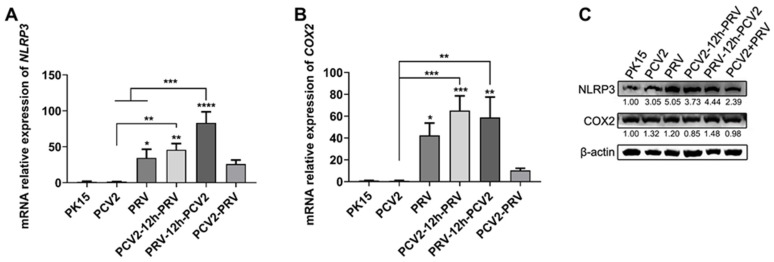
Figure 7.
Coinfection of PCV2 and PRV activates the NLRP3 pathway. (A,B) Expression levels of NLRP3 and COX2. The relative mRNA levels of NLRP3 (A) and COX2 (B) were examined via Real-time PCR. The data are presented as the means ± SD. *, p-value < 0.05; **, p-value < 0.01; ***, p-value < 0.001; ****, p-value < 0.0001. (C) Protein levels of NLRP3 and COX2. Western blotting was performed using NLRP3, Cox-2, and Anti-β-Actin Antibody as primary antibodies, respectively. HRP-labeled Goat Anti-mouse IgG (H+L) and HRP-labeled Goat Anti-rabbit IgG (H+L) were used as the secondary antibody. β-actin was used as a control. The average expression level of the target protein in each group is shown below each lane. The protein amount of the PK-15 group is set to 1, and the values of other groups are the ratio with the PK-15 group. Unprocessed original images can be found in Supplementary Figure S6.

