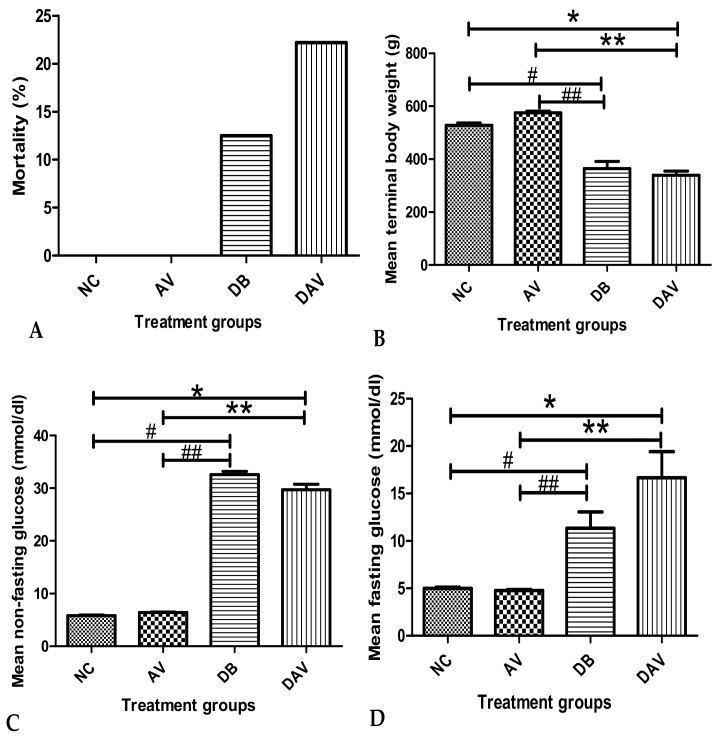
Figure 1.
Mean mortality, terminal body weight and fasting and non-fasting blood glucose levels. (A) No mortality in the NC and AV groups, but (12.5%) 1 and (22.22%) 2 mortalities in DB and DAV, respectively. (B) Significant difference in mean body weight across groups (Kruskal–Wallis test, p ≤ 0.0001). ‘*’ DAV vs. NC and ‘#’ DB vs. NC (p = 0.034 and 0.03 respectively) and ‘**’ DAV vs. AV and ‘##’ DB vs. AV significantly decreased (p = 0.0001, Dunn’s pairwise post hoc test). (C) Significant difference in the mean NFBG between groups (Kruskal–Wallis test, p ≤ 0.0001), ‘*’ DAV vs. NC and ‘#’ DB vs. NC significantly increased (p = 0.0001 and 0.001, Dunn’s pairwise post hoc test). ‘**’ DAV vs. AV and ‘##’ DB vs. AV significantly increased (p = 0.05 and 0.008 respectively). (D) Significant difference in the mean FBG between groups (Kruskal–Wallis test, p ≤ 0.001). ‘*’ DAV vs. NC and ‘#’ DB vs. NC significantly increased at p = 0.003 and 0.008, respectively. ‘**’ DAV vs. AV and ‘##’ DB vs. AV significantly increased (p = 0.004 and 0.05 respectively), n = 6. Key: NC, Controls; AV, cART only; DB, Diabetic; DAV, diabetic with cART.

