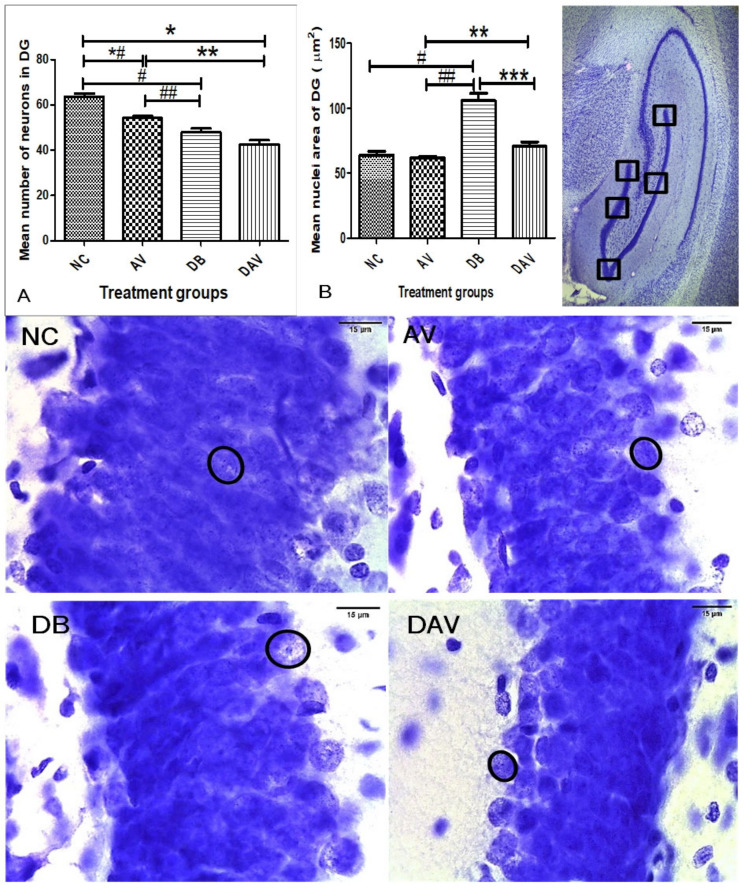
Figure 6.
Mean nuclei area and number of neurons in the dentate gyrus region of the dorsal hippocampus. (A) Significant changes in the mean number of neurons in the DG region (one-way ANOVA test, p ≤ 0.0001). ‘*’ DAV vs. AV, ‘*#’ AV vs. NC and ‘#’ DB vs. NC are significantly decreased (p = 0.001, 0.0001 and 0.0001, respectively). ‘**’ DAV vs. AV and ‘##’ DB vs. AV are significantly decreased (p = 0.0001). (B) Significant changes in the mean nuclei area in the DG region between the groups (Kruskal–Wallis test, p ≤ 0.005). ‘#’ DB vs. NC, ‘##’ DB vs. AV and ‘***’ DB vs. DAV are significantly increased (p = 0.0002, 0.0001, and 0.0001, respectively). ‘**’ DAV vs. AV, ‘#’ DB vs. NC, ‘##’ DB vs. AV and ‘***’ DB vs. DAV are significantly increased (p = 0.045). Circles indicate boundaries of neuronal nuclei, and squares indicate specific regions from which micrographs were taken and measurements made, n = 6. Scale bar = 15 µm. Key: NC, Controls; AV, cART only; DB, Diabetic; DAV, diabetic with cART.

