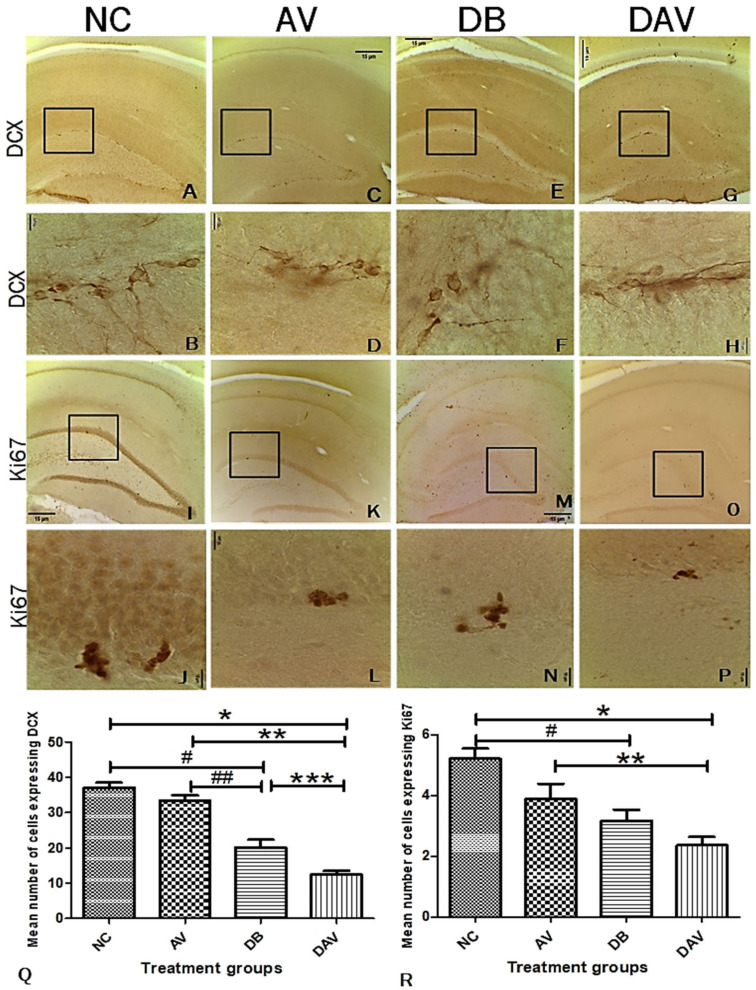
Figure 7.
Photomicrograph of the hippocampus showing the expression of DCX in the subgranular zone of the dentate gyrus region. (A,B) Expression of DCX in the control, showing numerous clusters of cell bodies and projections expressing DCX. (C,D) Expression of DCX in the AV group: several small pockets of cells and projections expressing DCX. (E,F) Expression of DCX in the DB group: few cells and their projections expressing DCX. (G,H) Expression of DCX in the DAV group: minimal number of cells expressing DCX, most of the DCX expression were observed in the projections. (I–P) Expression of Ki67 showing gradual reduction in Ki67 expression across the groups NC, AV, DB and DAV, respectively. (Q) Significant difference in the expression of DCX between groups (one-way ANOVA, p = 0.0001). ‘*’ DAV vs. NC, ‘**’ DAV vs. AV, ‘#’ DB vs. NC and ‘##’ DB vs. AV are significantly decreased (Bonferroni’s post hoc, p = 0.0001). ‘***’ DAV vs. DB significantly decreased (Bonferroni’s post hoc, p = 0.011). (R) Significant difference in expression of Ki67 between the groups (one-way ANOVA, p = 0.0001). ‘*’ DAV vs. NC and ‘#’ DB vs. AV are significantly decreased (Bonferroni’s post hoc, p = 0.007 and 0.0001, respectively). ‘**’ DAV vs. AV is significantly decreased (Bonferroni’s post hoc, p = 0.05). Photomicrographs at ×100; squares indicate the area captured at ×1000 magnification, n = 6. Scale bar = 15 µm. Key: NC, Controls; AV, cART only; DB, Diabetic; DAV, diabetic with cART.

