Figure 1.
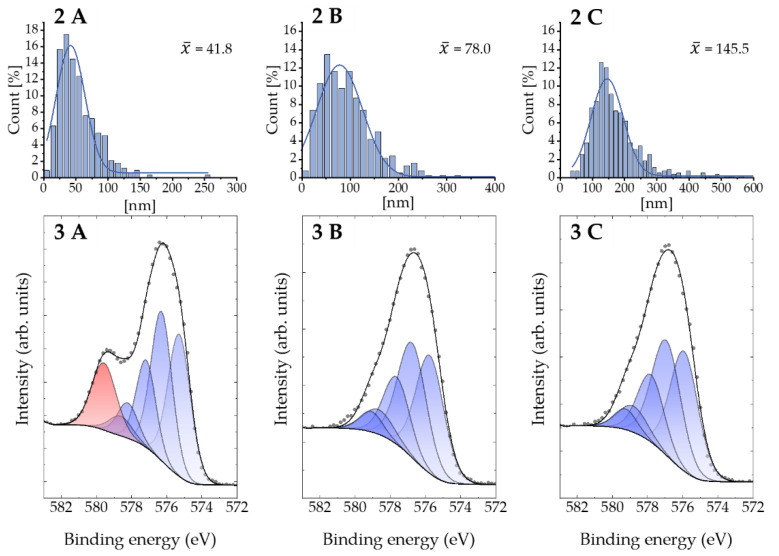
Physicochemical characterization of different Cr2O3 particles. Size distribution was measured in ultrapure water at a concentration of 10 µg/cm². 1A–1C: representative transmission electron microscopy (TEM) images of the particles. 2A–2C: average diameters of particle A (42 nm), B (78 nm) and C (146 nm). 3A–3C: X-ray photoelectron spectroscopy (XPS) spectra of the particles. The red signal at 579.6 eV only present in Figure 1(3A) is characteristic for Cr(VI), while the blue multiplet signal between 575.3 and 578.6 eV is characteristic for Cr(III).


