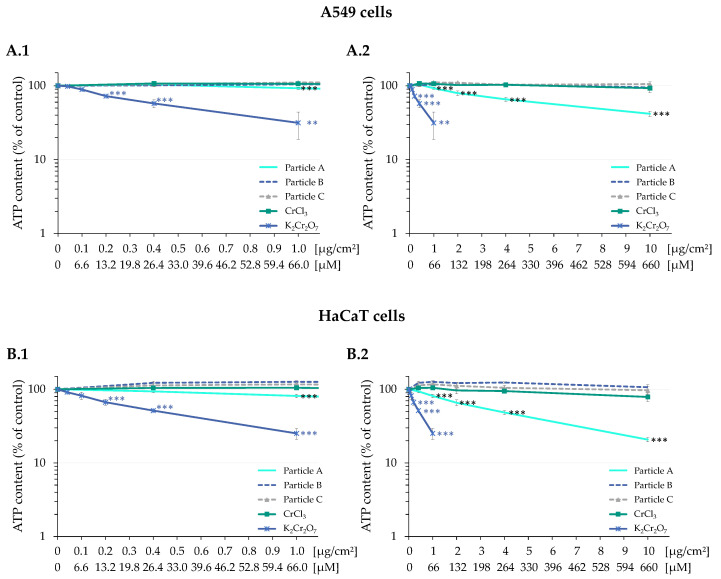
Figure 2.
ATP content of A549 (A) and HaCaT (B) cells after 24 h treatment with Cr(III) oxide particles Cr2O3, CrCl3, or K2Cr2O7. Treatments below 66 µM (corresponding to 1 μg/cm2 chromium) are shown in (A.1) and (B.1). Treatments covering the entire dose range investigated are depicted in (A.2) and (B.2). Mean values ± standard deviations derived from three independent experiments are shown. Statistics were performed using ANOVA followed by Dunnett’s T post hoc test: ** p ≤ 0.01, *** p ≤ 0.001.

