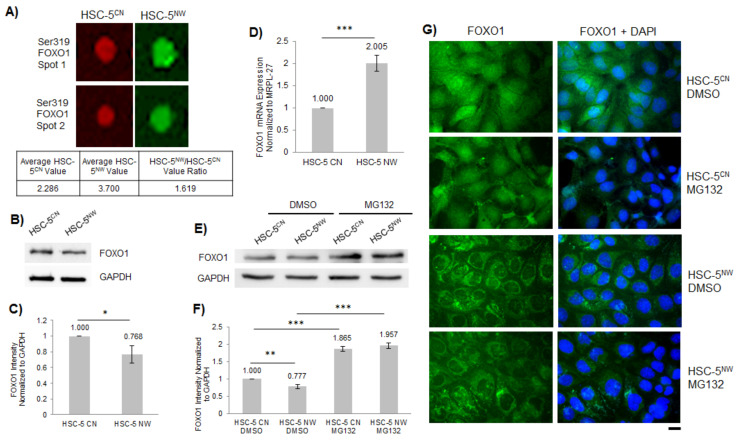
Figure 4.
FOXO1 expression is reduced in HSC-5NW cells. (A) Individual duplicate arrays of phospho-Ser319 FOXO1 for the HSC-5CN (red) and HSC-5NW (green) cell lysate protein microarrays; the complete Kinex KAM-880 microarray is shown in Figure S2. The average values of HSC-5CN and HSC-5NW cell phospho-Ser319 FOXO1 arrays are shown. (B) Representative Western blots of FOXO1 and GAPDH in HSC-5CN and HSC-5NW cells; n = 3. (C) Densitometric quantification of the FOXO1/GAPDH ratio in HSC-5CN and HSC-5NW cells normalized to HSC-5CN cells. (D) Total RNA was extracted from HSC-5CN and HSC-5NW cells and reverse-transcribed to cDNA for quantifying FOXO1 expression relative to MRPL-27 using real-time PCR, normalized to HSC-5CN cells. (E) Representative Western blots of FOXO1 and GAPDH in HSC-5CN and HSC-5NW cells treated with 10 µM MG132 or DMSO; n = 3. (F) Densitometric quantification of the FOXO1/GAPDH ratio in HSC-5CN and HSC-5NW cells treated as in (E) normalized to DMSO-treated HSC-5CN cells. (G) Representative immunofluorescence images of HSC-5CN and HSC-5NW cells treated as in (E) stained for FOXO1 (green). Nuclei were counterstained with DAPI (blue). Scale bar represents 20 µm, n = 3. All values are the mean ± SD, n = 3, * p < 0.05, ** p < 0.01, ***p < 0.001.

