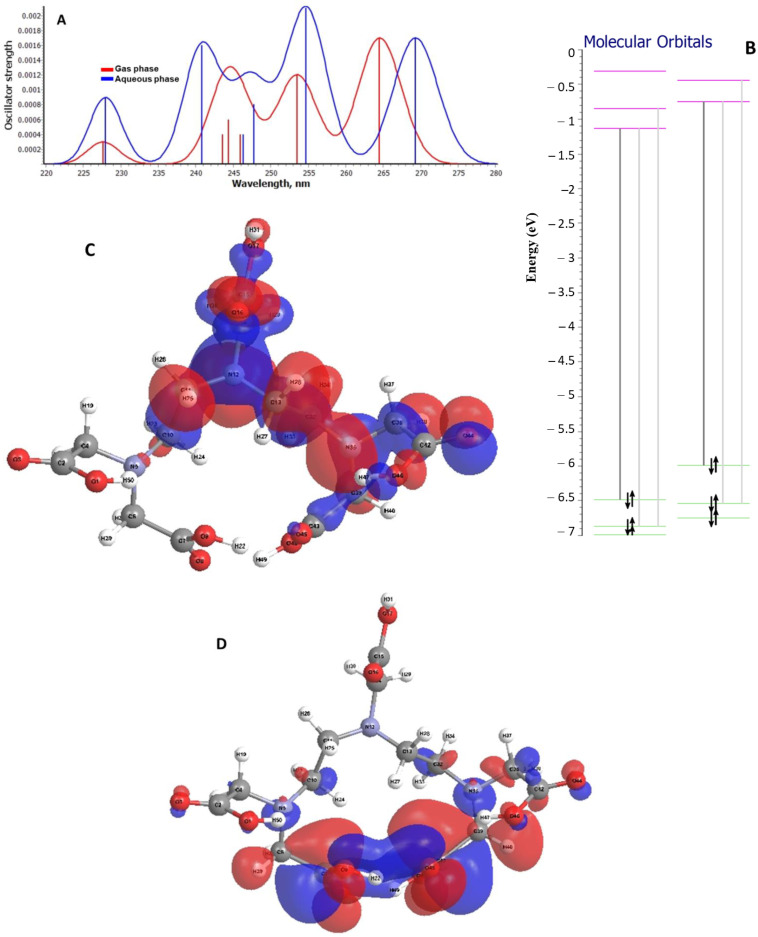
Figure 13.
(A) Simulation of the electronic spectra for the DTPA structure in both the gas and aqueous phase. (B) Fragment from the energy diagram of the molecular orbitals of the DTPA structure illustrating the first electronic transition: (a) gas phase; (b) aqueous phase. The spatial representation of boundary orbitals for DTPA structure in gaseous phase (C) HOMO and (D) LUMO.

