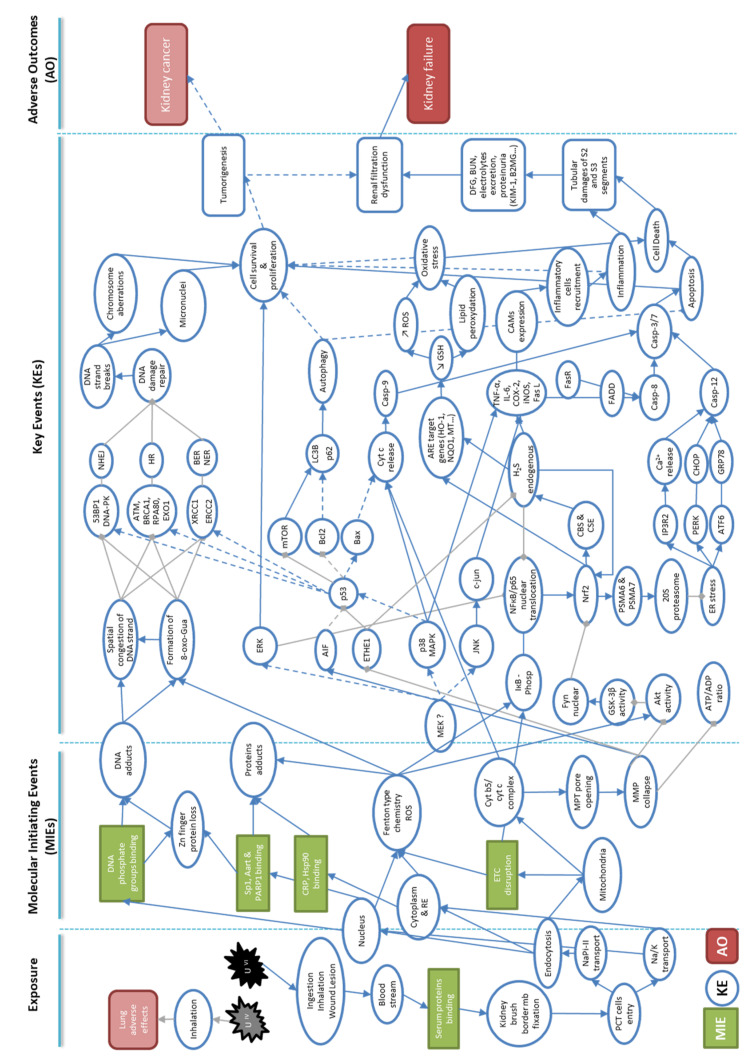
Figure 2.
Representative network of identified molecular and cellular key events leading to adverse outcome pathways used in the development of an AOP to kidney failure in the context of U-exposure. Molecular initiating events (MIEs) are represented in green rectangles, and key events (KEs) in blue circles. Finally, the resulting adverse outcomes (AOs) are represented in red rectangles. Filled blue arrows are proven links of induction based on experimental or epidemiological studies of U nephrotoxicity, and gray segments represent links of inhibition. Dotted blue arrows represent hypothetical links that exist between the different key events.

