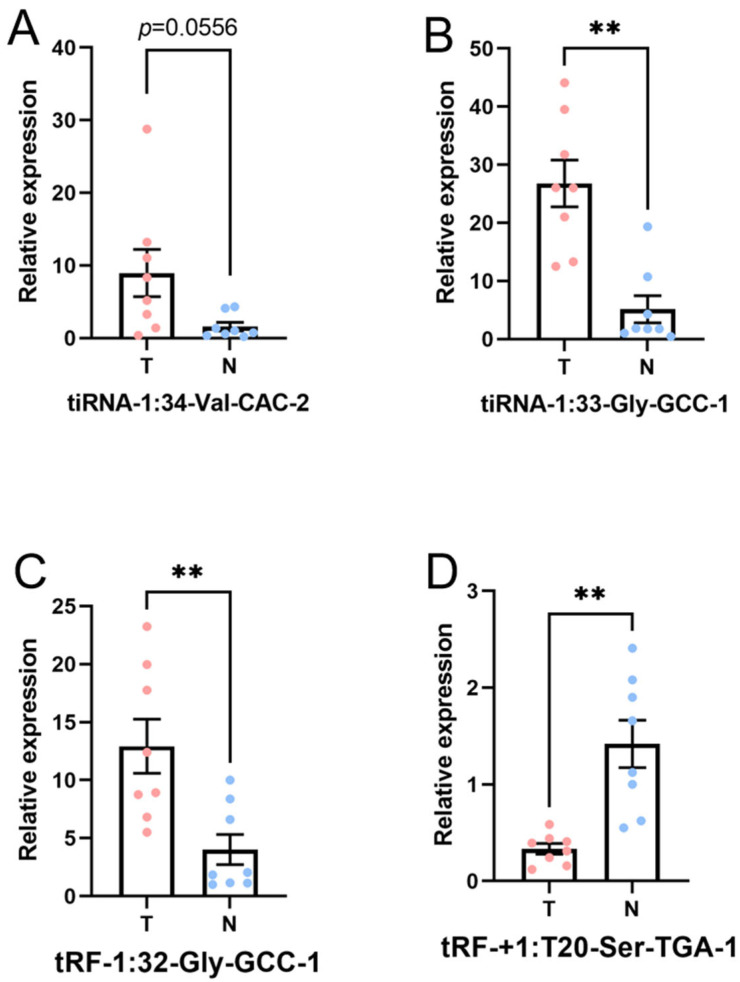
Figure 7.
Expression level of the candidate tsRNAs (T, tumor group. N, paracancer group). The data were normalized using the mean ± SEM. (A) tiRNA-1:34-Val-CAC-2 (p-value = 0.0556), (B) tiRNA-1:33-Gly-GCC-1 (p-value < 0.01), (C) tRF-1:32-Gly-GCC-1 (p-value < 0.01), and (D) tRF-+1:T20-Ser-TGA-1 (p-value < 0.01). ** indicates p-value < 0.01.

