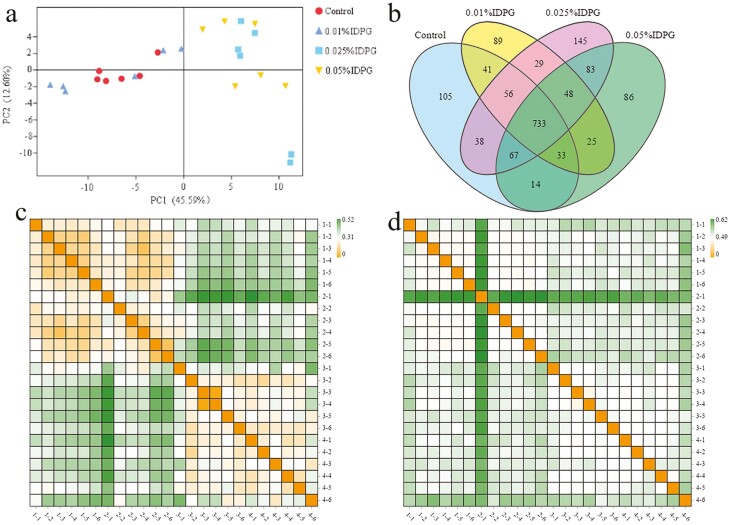
Figure 1.
Analysis of OTUs and diversity of cecal microbiome of four groups supplemented with different doses of incomplete degradation products of galactomannan (IDPG). PCA plot (a); Venn diagram of the OTUs in the four treatments (b); Heat maps based, respectively, on weighted and unweighted UniFrac distances of gut microbial communities of four treatments (c, d). Control group (1-1 to 1-6), 0.01% IDPG group (2-1 to 2-6), 0.025% IDPG group (3-1 to 3-6), and 0.05% IDPG group (4-1 to 4-6).

