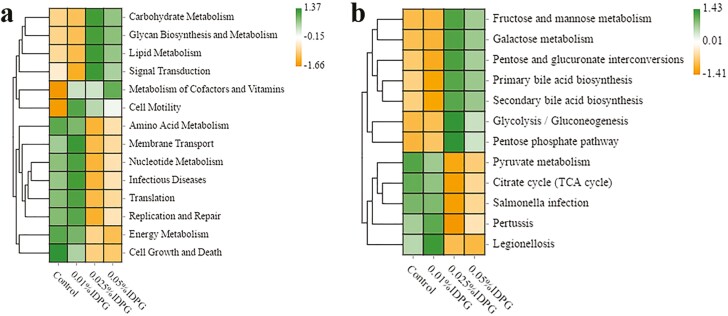
Figure 3.
Heat maps of the comparison of cecal microbial functionality in the laying hens supplemented with different doses of incomplete degradation products of galactomannan. Tukey’s honestly significant difference showed significant differences between the groups (P < 0.05). Metabolic prediction based on subclass level 2 and 3, respectively (a, b).

