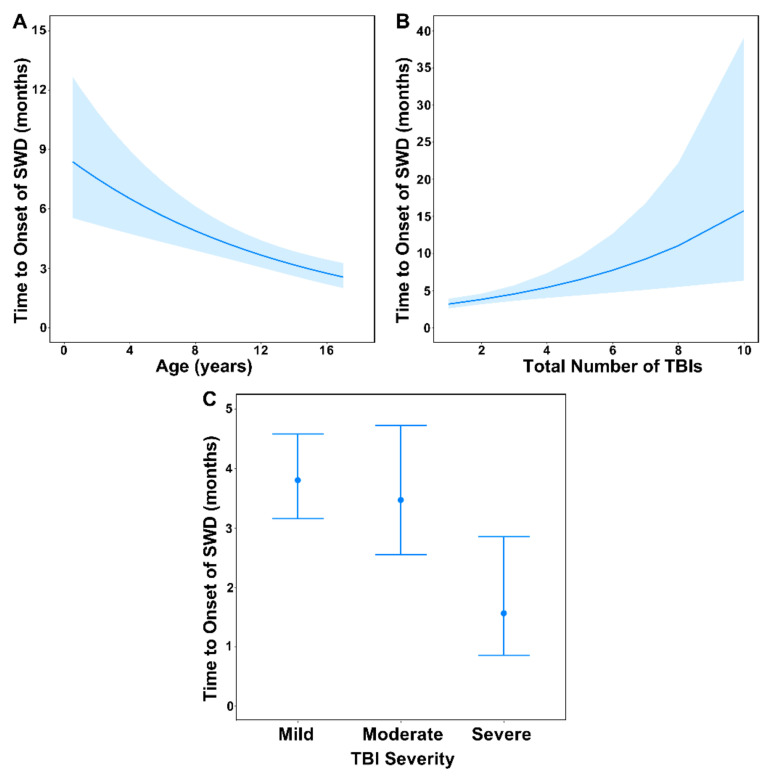
Figure 4.
Marginal effects point estimates (solid blue lines or blue circles) and corresponding 95% confidence intervals (blue shaded areas or error bars) from the top-ranked negative-binomial generalized linear model predicting the effects of (A) age at initial TBI, (B) total number of TBIs prior to the onset of sleep-wake disturbances, and (C) severity of initial TBI on the time to onset of sleep-wake disturbances following injury.

