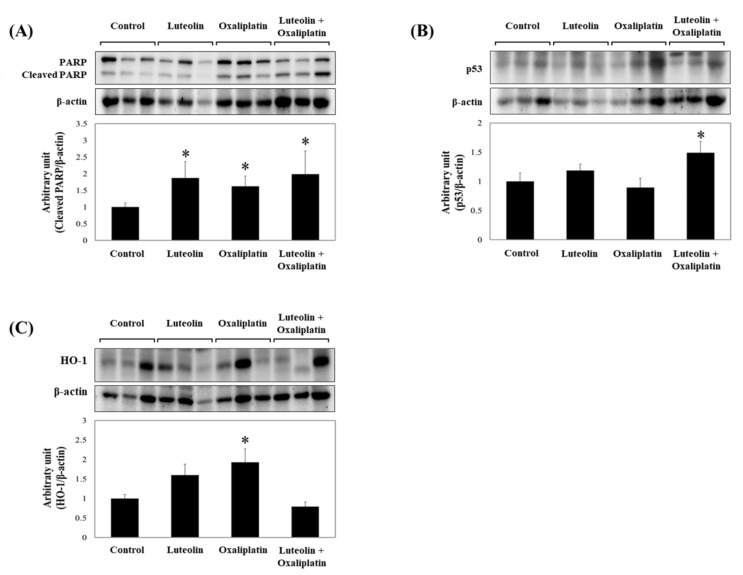
Figure 3.
Relative protein levels in HCT116 xenograft tumor homogenates. (A–C) HCT116 xenograft tumors were collected from mice treated with luteolin and/or oxaliplatin. The total proteins were extracted from the tumor tissues and subjected to western blotting analysis, which was used to quantify the expression of following proteins: cleaved PARP (A), p53 (B), and HO-1 (C). Densitometric data, presented as the mean ± SD (n = 6–7 per group) with representative western blotting bands displayed above each graph. Significant differences between groups at p < 0.05 is indicated by an asterisk (*).

