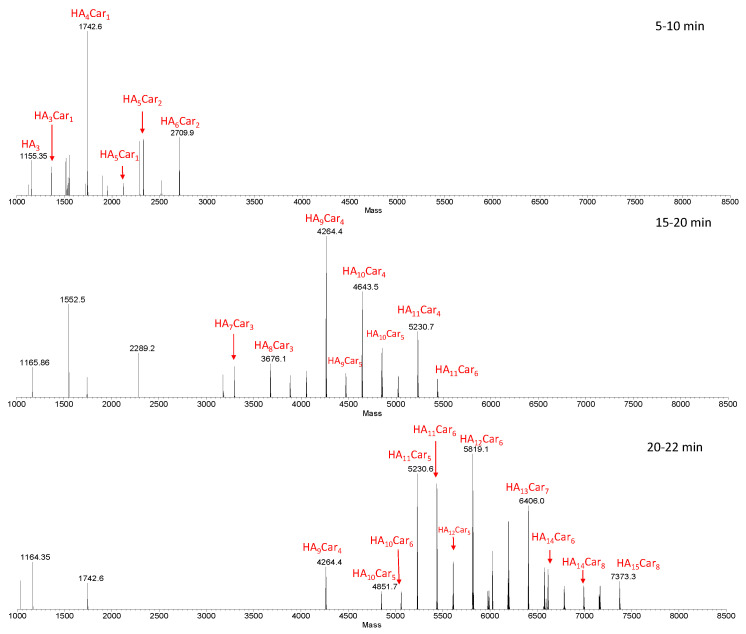
Figure 3.
Deconvoluted spectra obtained from the average MS spectra acquired during the LC-MS analysis within specific RT ranges (5–10, 15–20 and 20–22 min). The species show the number of the repetitive units (HA) and that of carnosine (Car). The sample was obtained by the hydrolysis of HyCar20 catalyzed by HyAse (500 U/mL).

