
Figure 5.
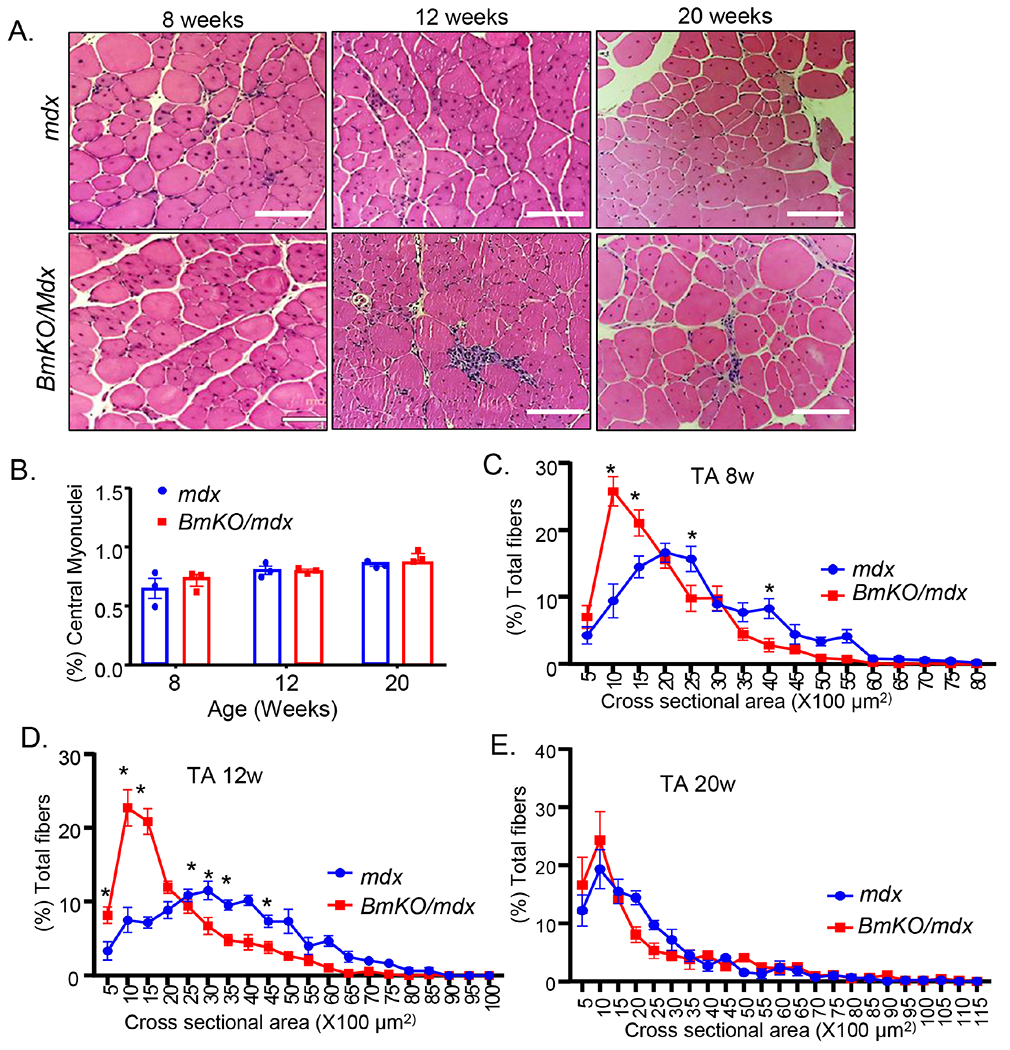
Loss of Bmal1 exacerbates muscle damage in TA of dystrophic mice. (A) Representative H/E images of TA cross section of 8, 12 and 20-weeks-old mdx and BmKO/mdx mice (10X). Scale bar: 100 μm. (B) Quantification of the percent of central nuclei-containing myofibers in TA cross section in mdx and BmKO/mdx mice at indicated ages (n=3-5/group). (C-E) TA muscle cross-section area distribution as percentage of total myofibers in 8 (C), 12 (D) and 20 weeks-old (E) mdx and BmKO/mdx mice (n=5-6/group). *, ** P≤0.05 or 0.01 BmKO/mdx vs. mdx control.