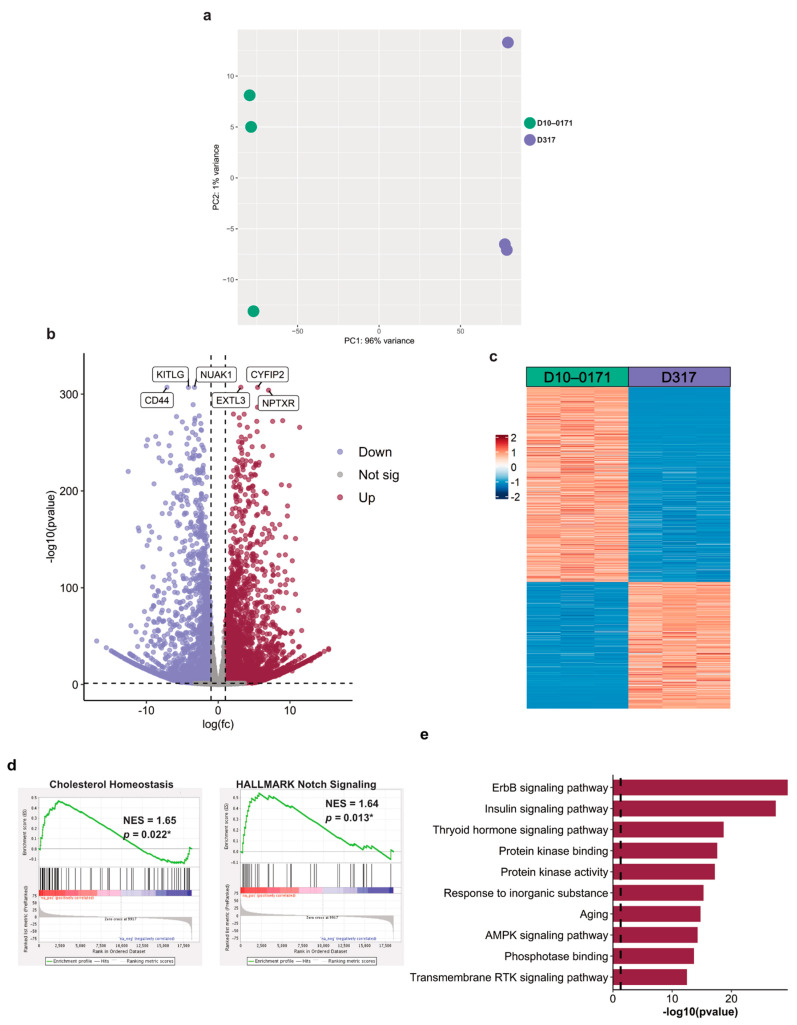
Figure 3.
D10-0171 and D317 cells exhibit molecular differences. (a) PCA plot of transcriptomic data demonstrates separation of D10-0171 and D317 GSCs. (b) Volcano plot of differentially expressed genes between D10-0171 and D317 showing up and downregulated genes in D10-0171 compared to D317. The most significantly up and downregulated genes are labeled. (c) Heatmap of differentially expressed genes between the D10-0171 and D317. (d) Enrichment plots of significantly upregulated pathways in D10-0171 compared to D317 using hallmark gene set enrichment analysis. p-values shown are false discovery rate-adjusted p-values. (e) Functional enrichment analysis (Metascape [36]) of upregulated pathways across input gene lists of phosphoproteins with increased expression in D10-0171 compared to D317. The dashed line represents a p-value of 0.05. * p < 0.05, NES, normalized enrichment score; AMPK, AMP-activated protein kinase; RTK, receptor tyrosine kinase.

